My Organization's First R package
Write R Code
rstudio::conf(2020L)
1 / 44
2 / 44
Writing Functions: Review
3 / 44
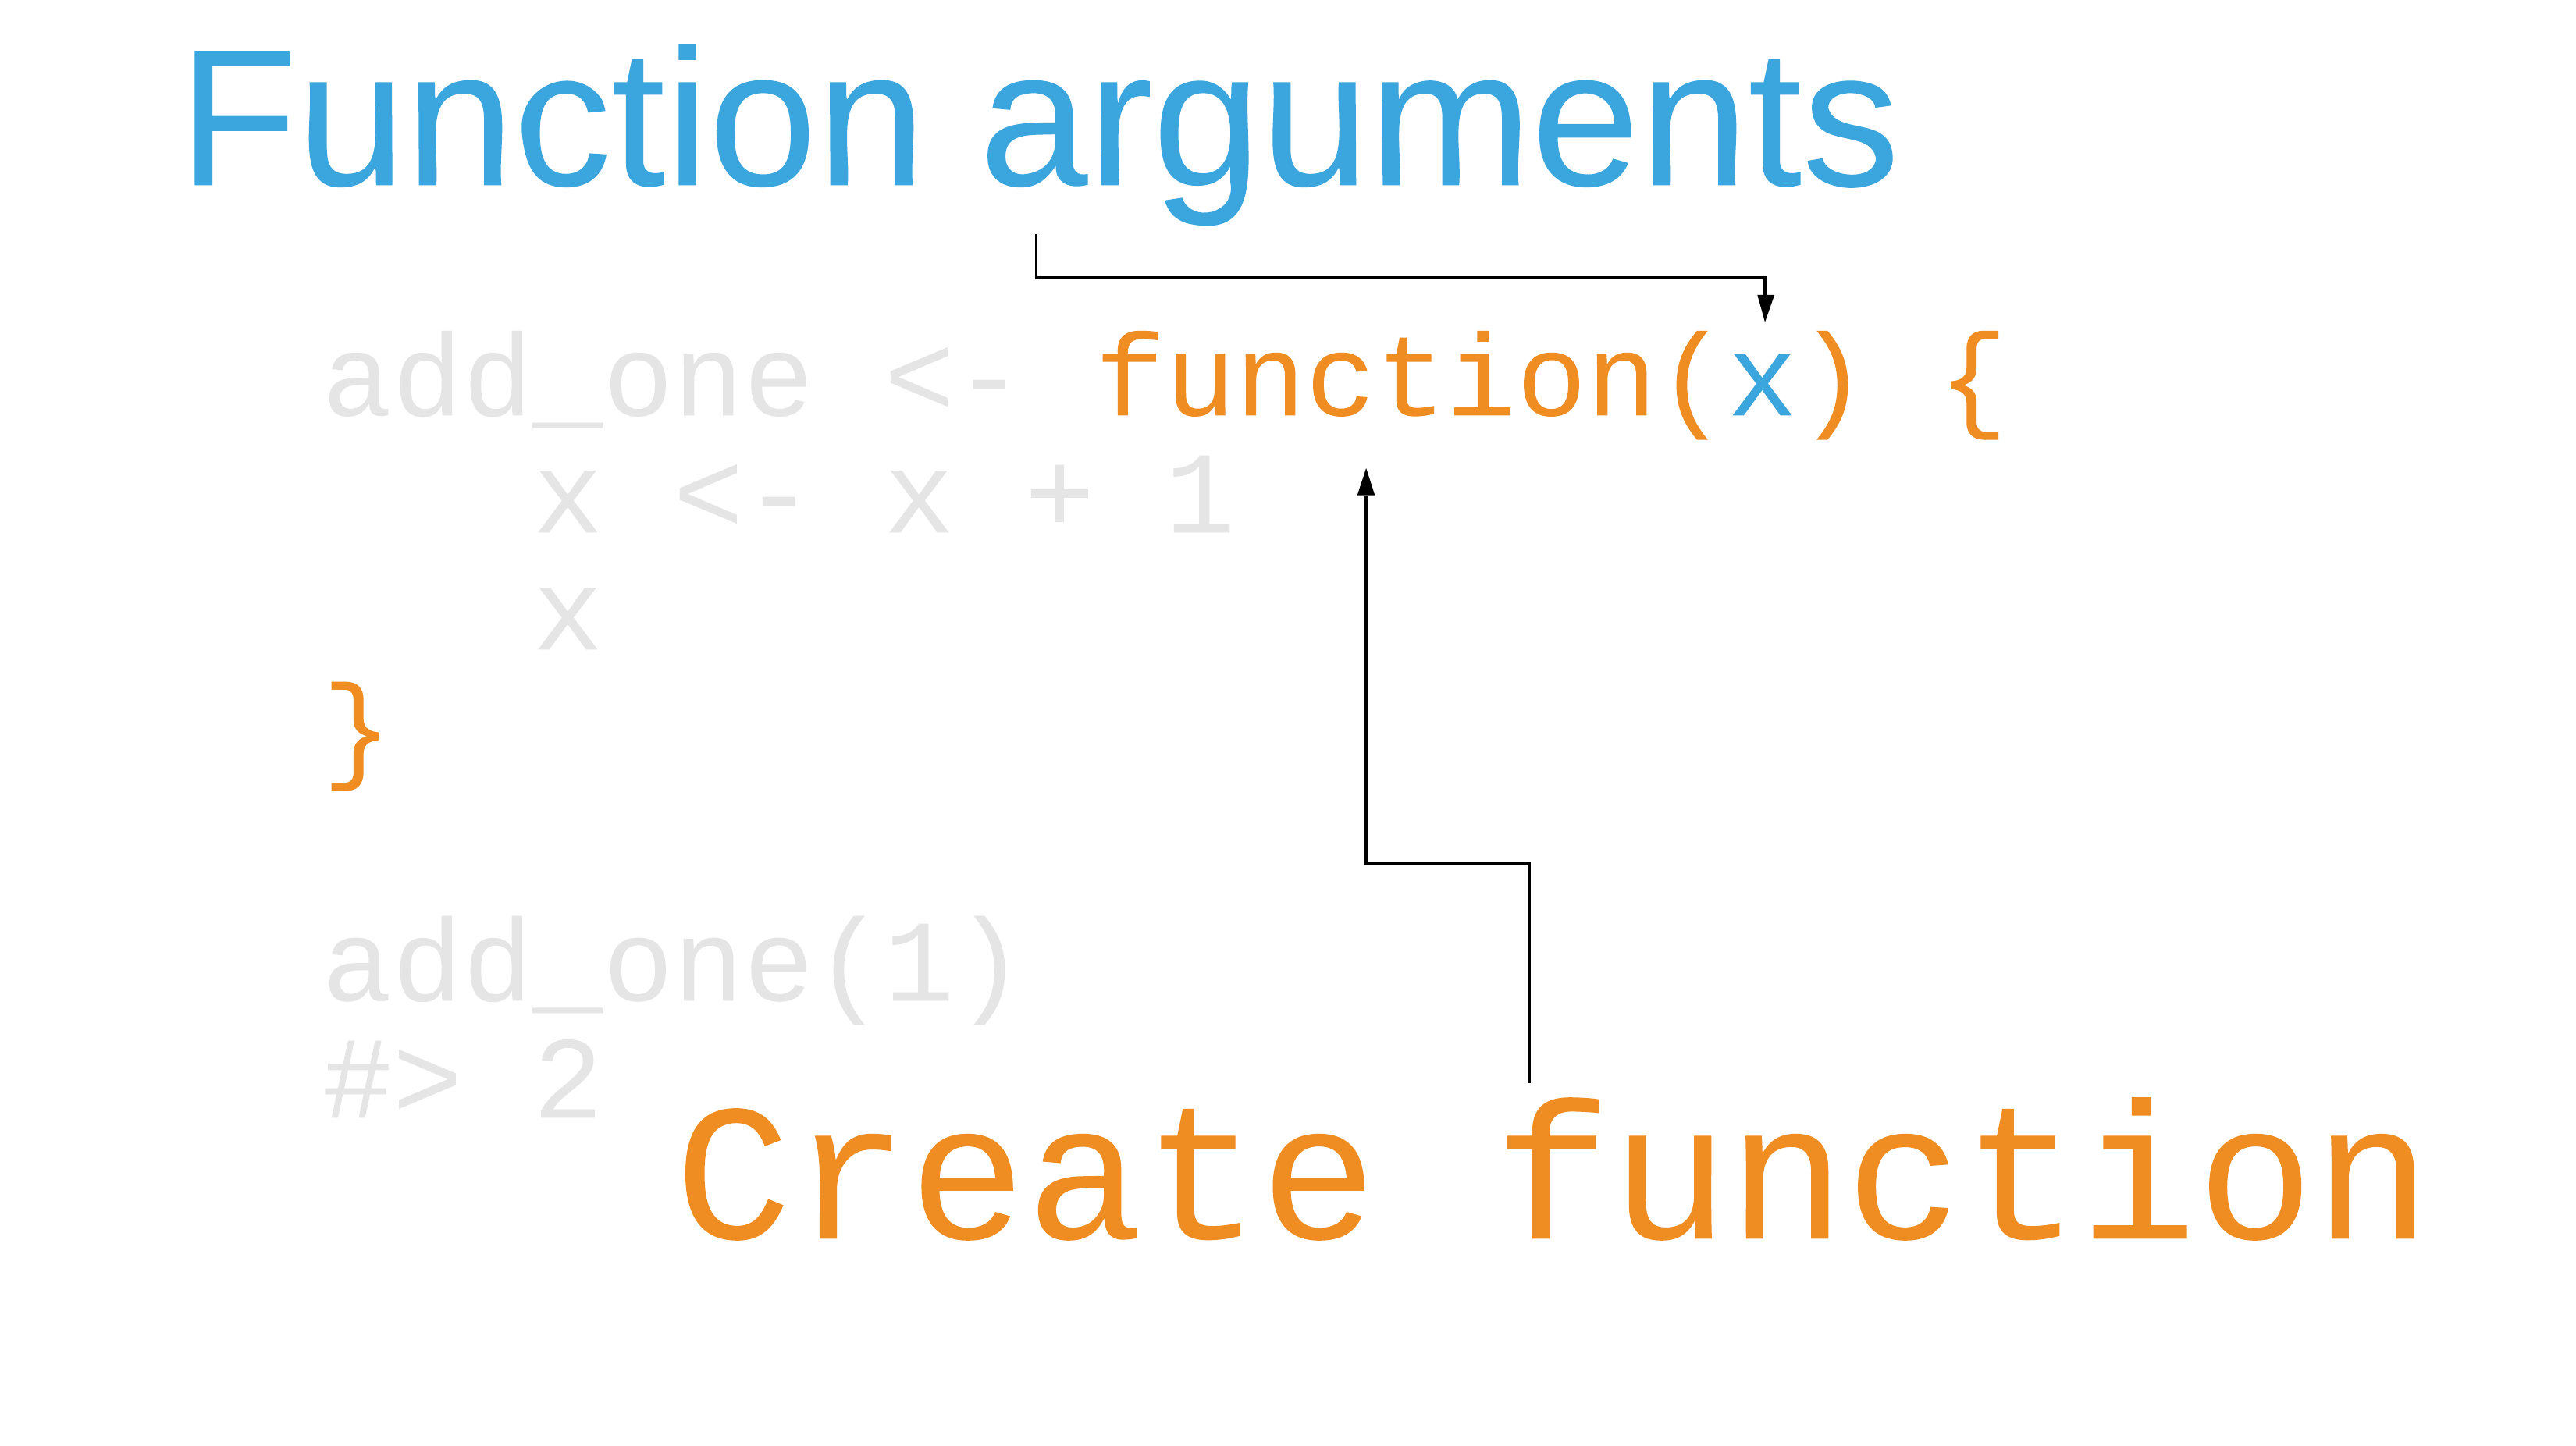
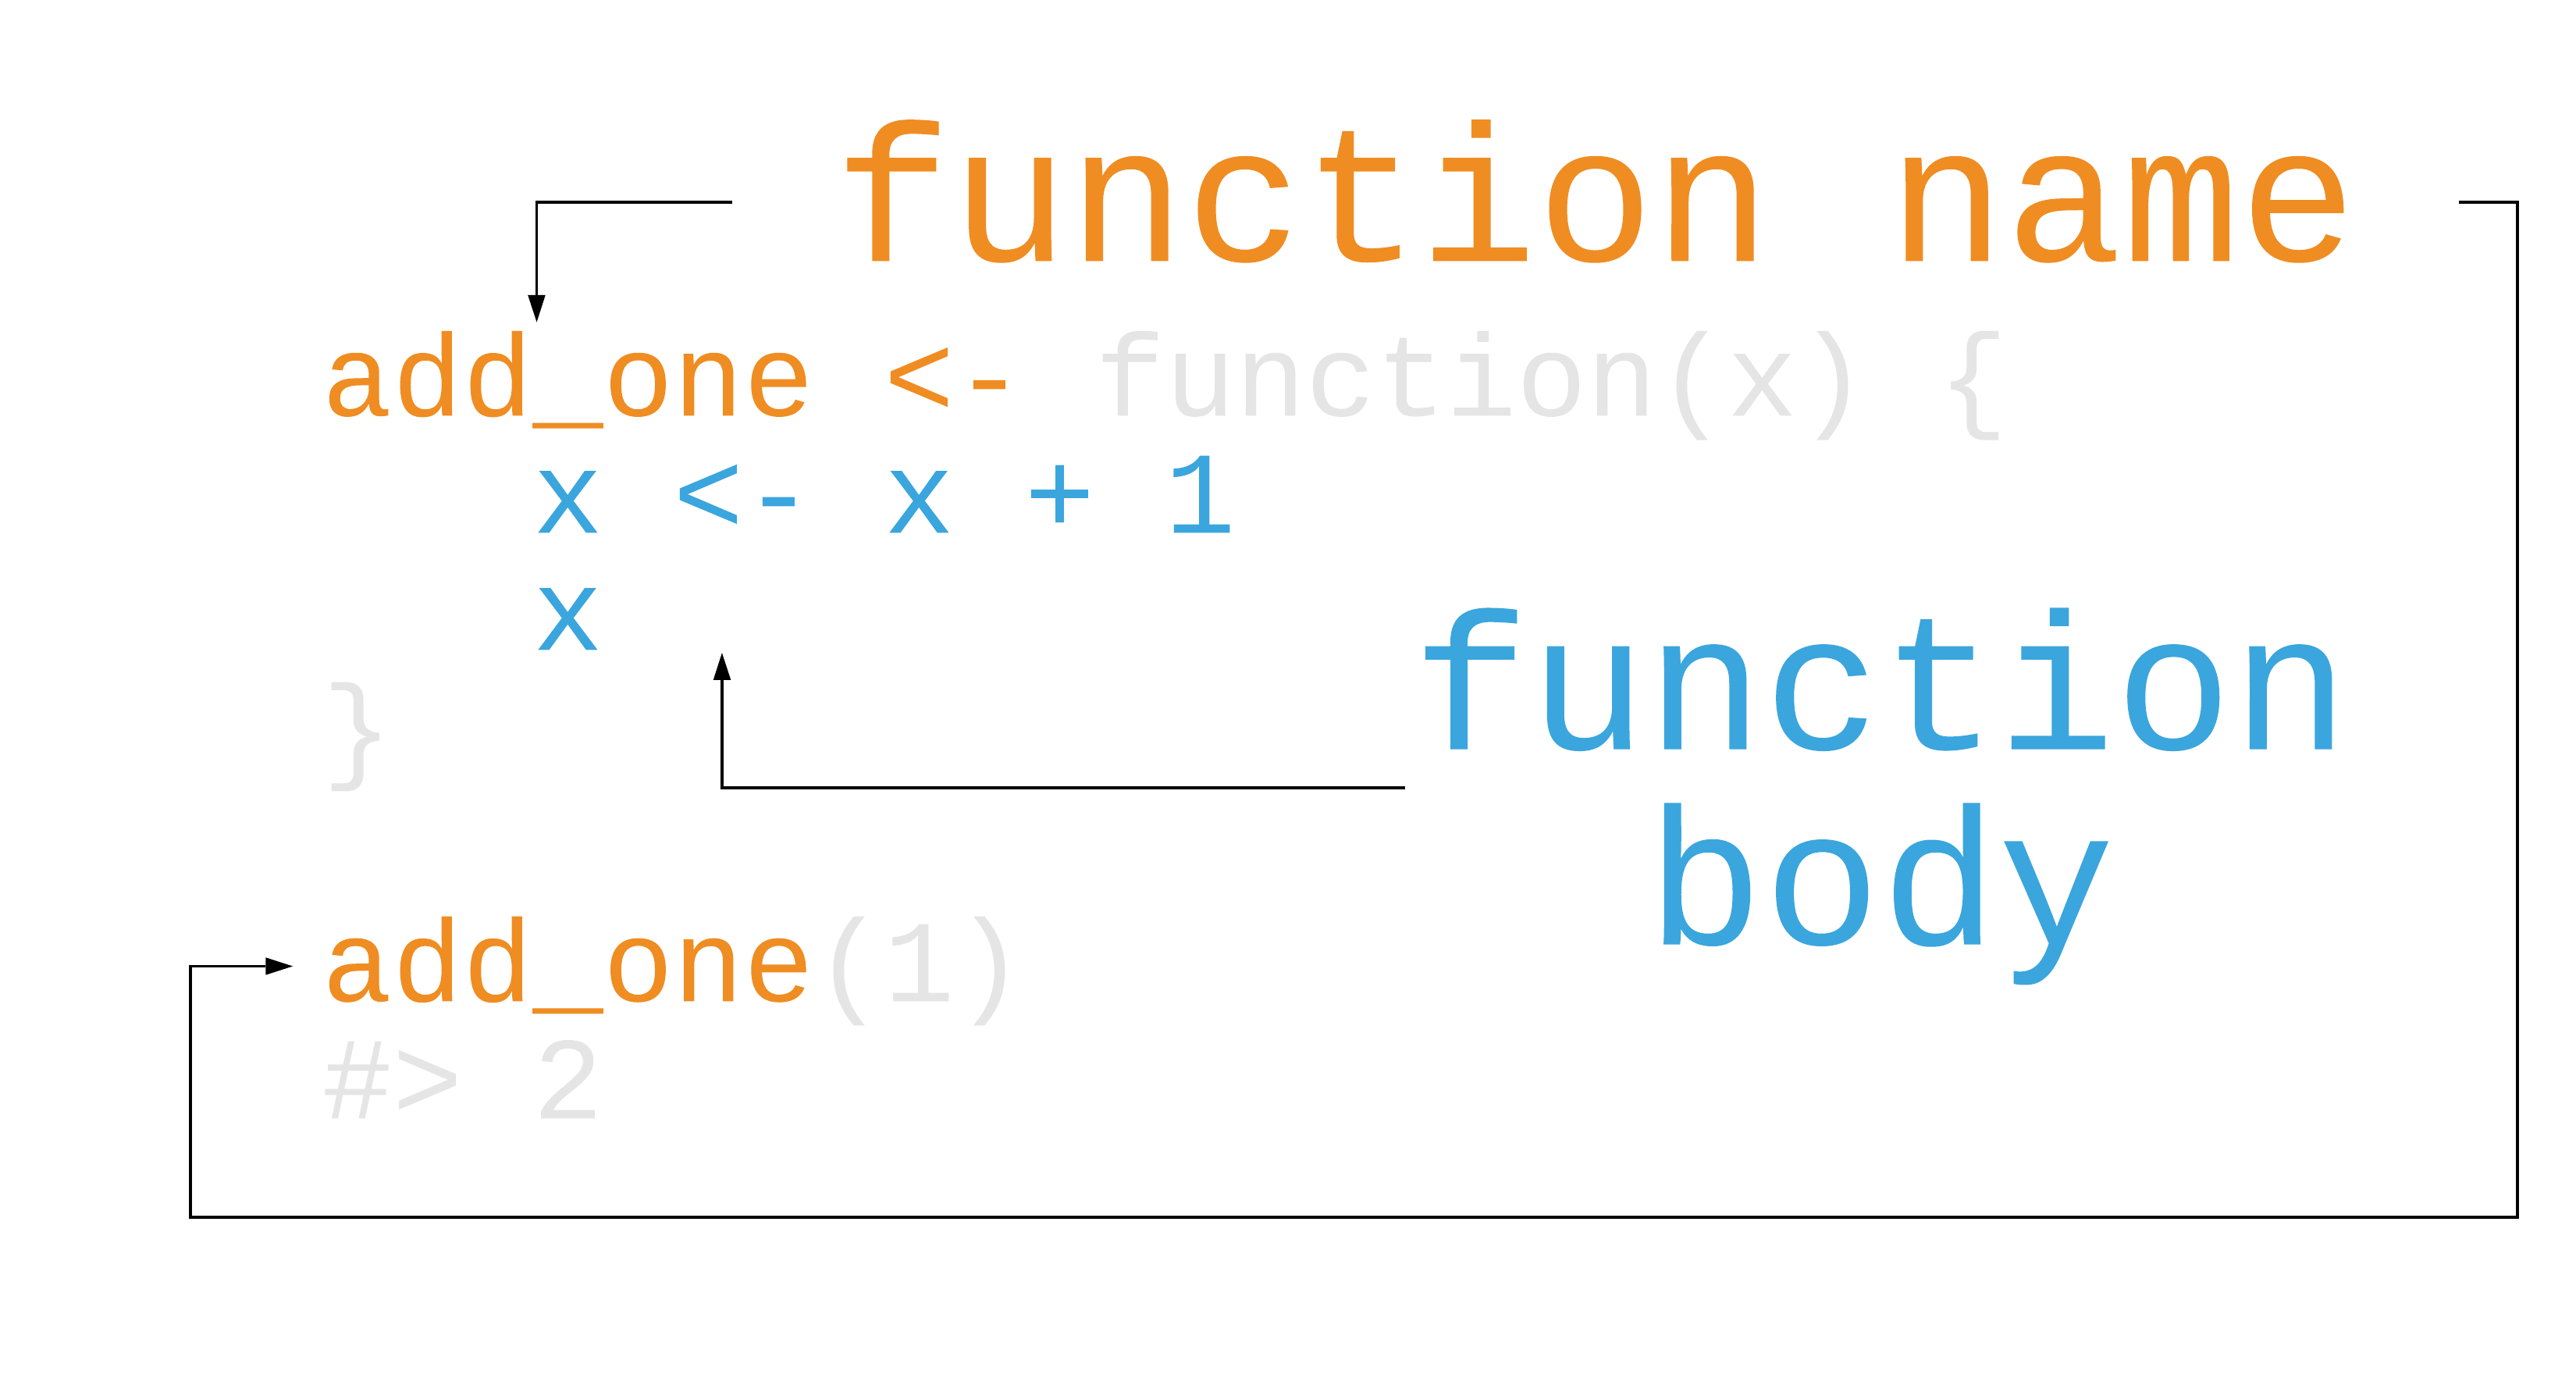
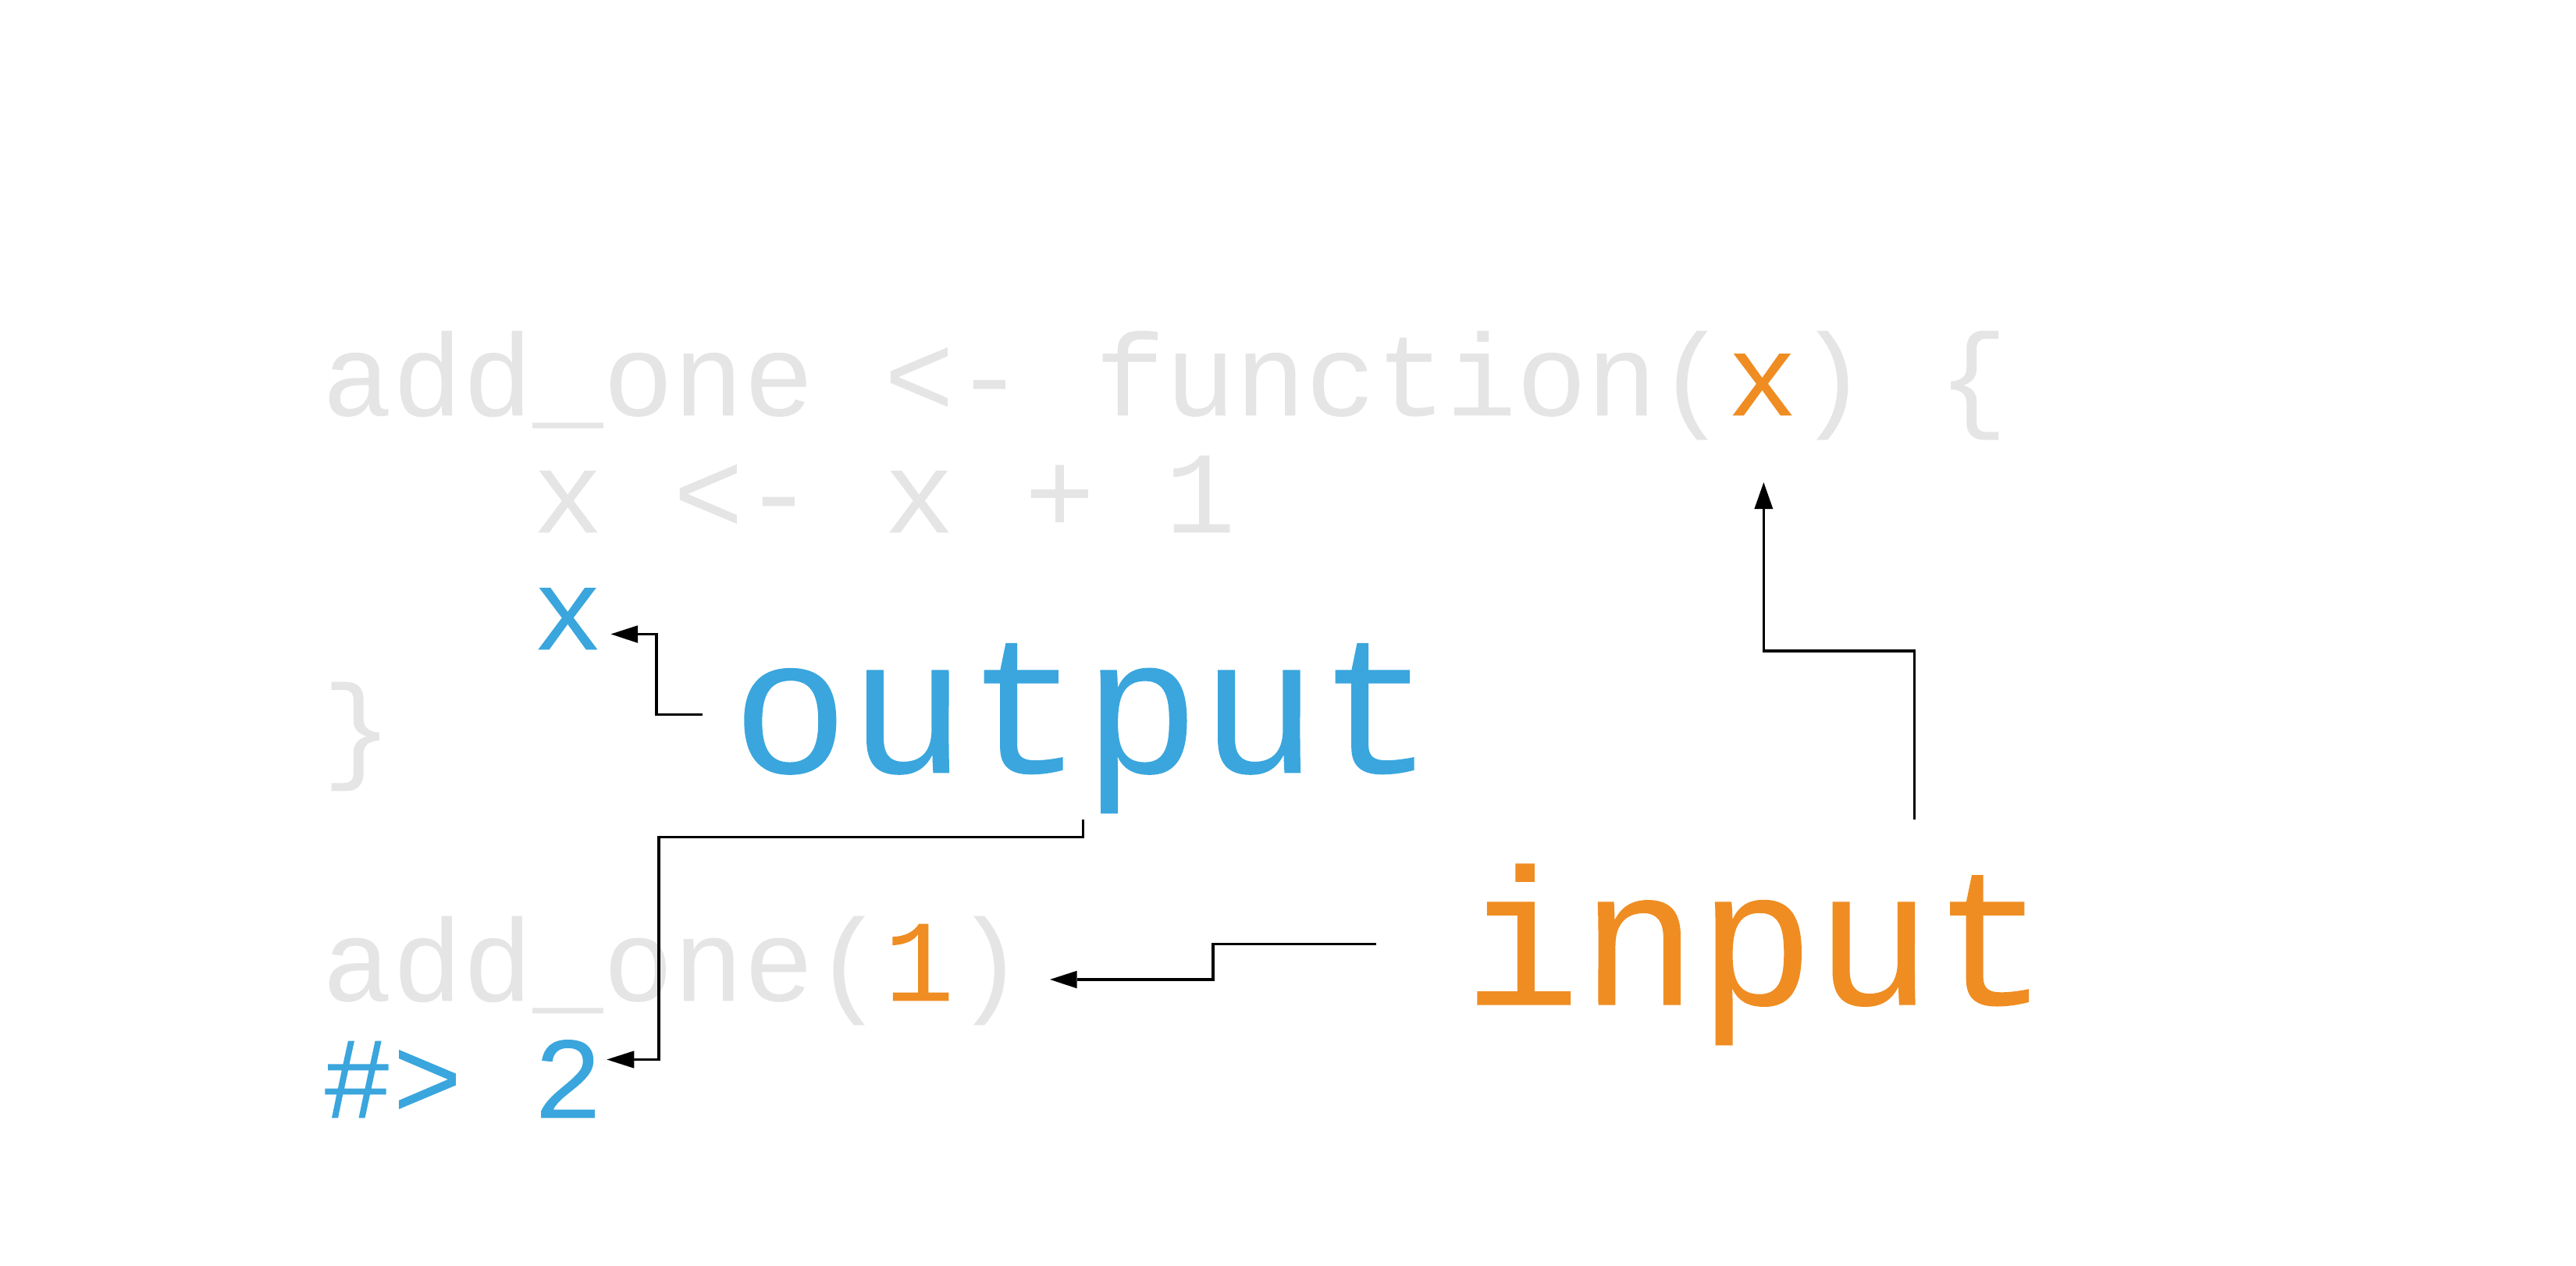
Writing functions

4 / 44
5 / 44
6 / 44
7 / 44
Your Turn 1
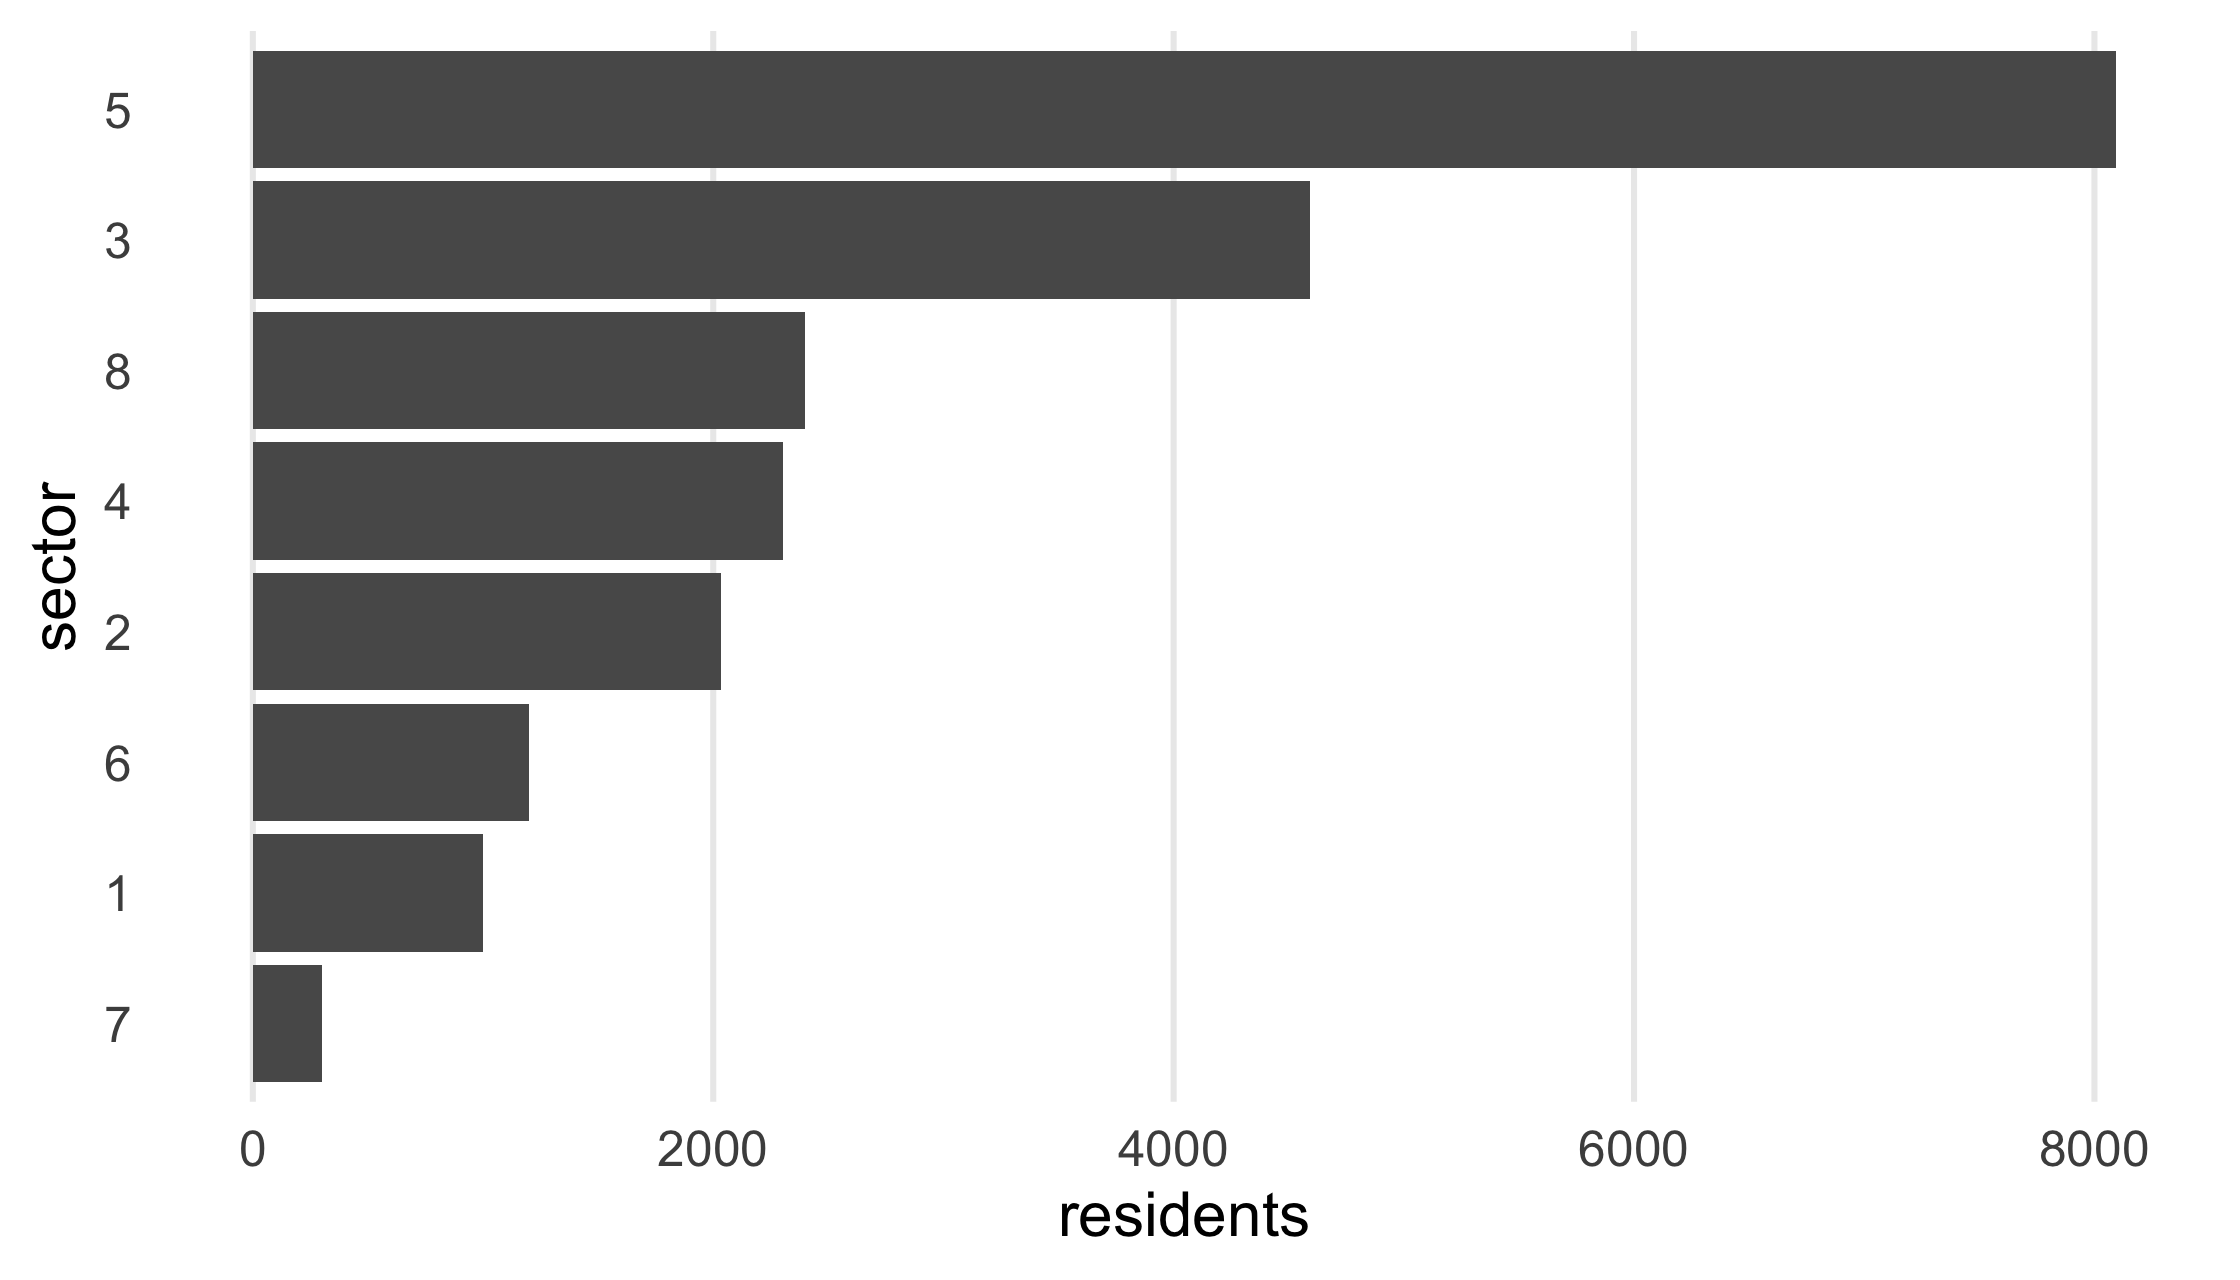
Re-write this ggplot2 theme as a function. Call it theme_avalanche_h().
Run this code to test that your function works
8 / 44
Your Turn 1
theme_avalanche_h <- function() { theme_minimal(base_size = 14) + theme(panel.grid.minor = element_blank(), panel.grid.major.y = element_blank())} residents_per_sector <- data.frame( sector = as.factor(1:8), residents = c(1000, 2034, 4594, 2304, 8093, 1200, 300, 2398) )ggplot(residents_per_sector, aes(forcats::fct_reorder(sector, residents), residents)) + geom_col() + coord_flip() + xlab("sector") + theme_avalanche_h()9 / 44
10 / 44
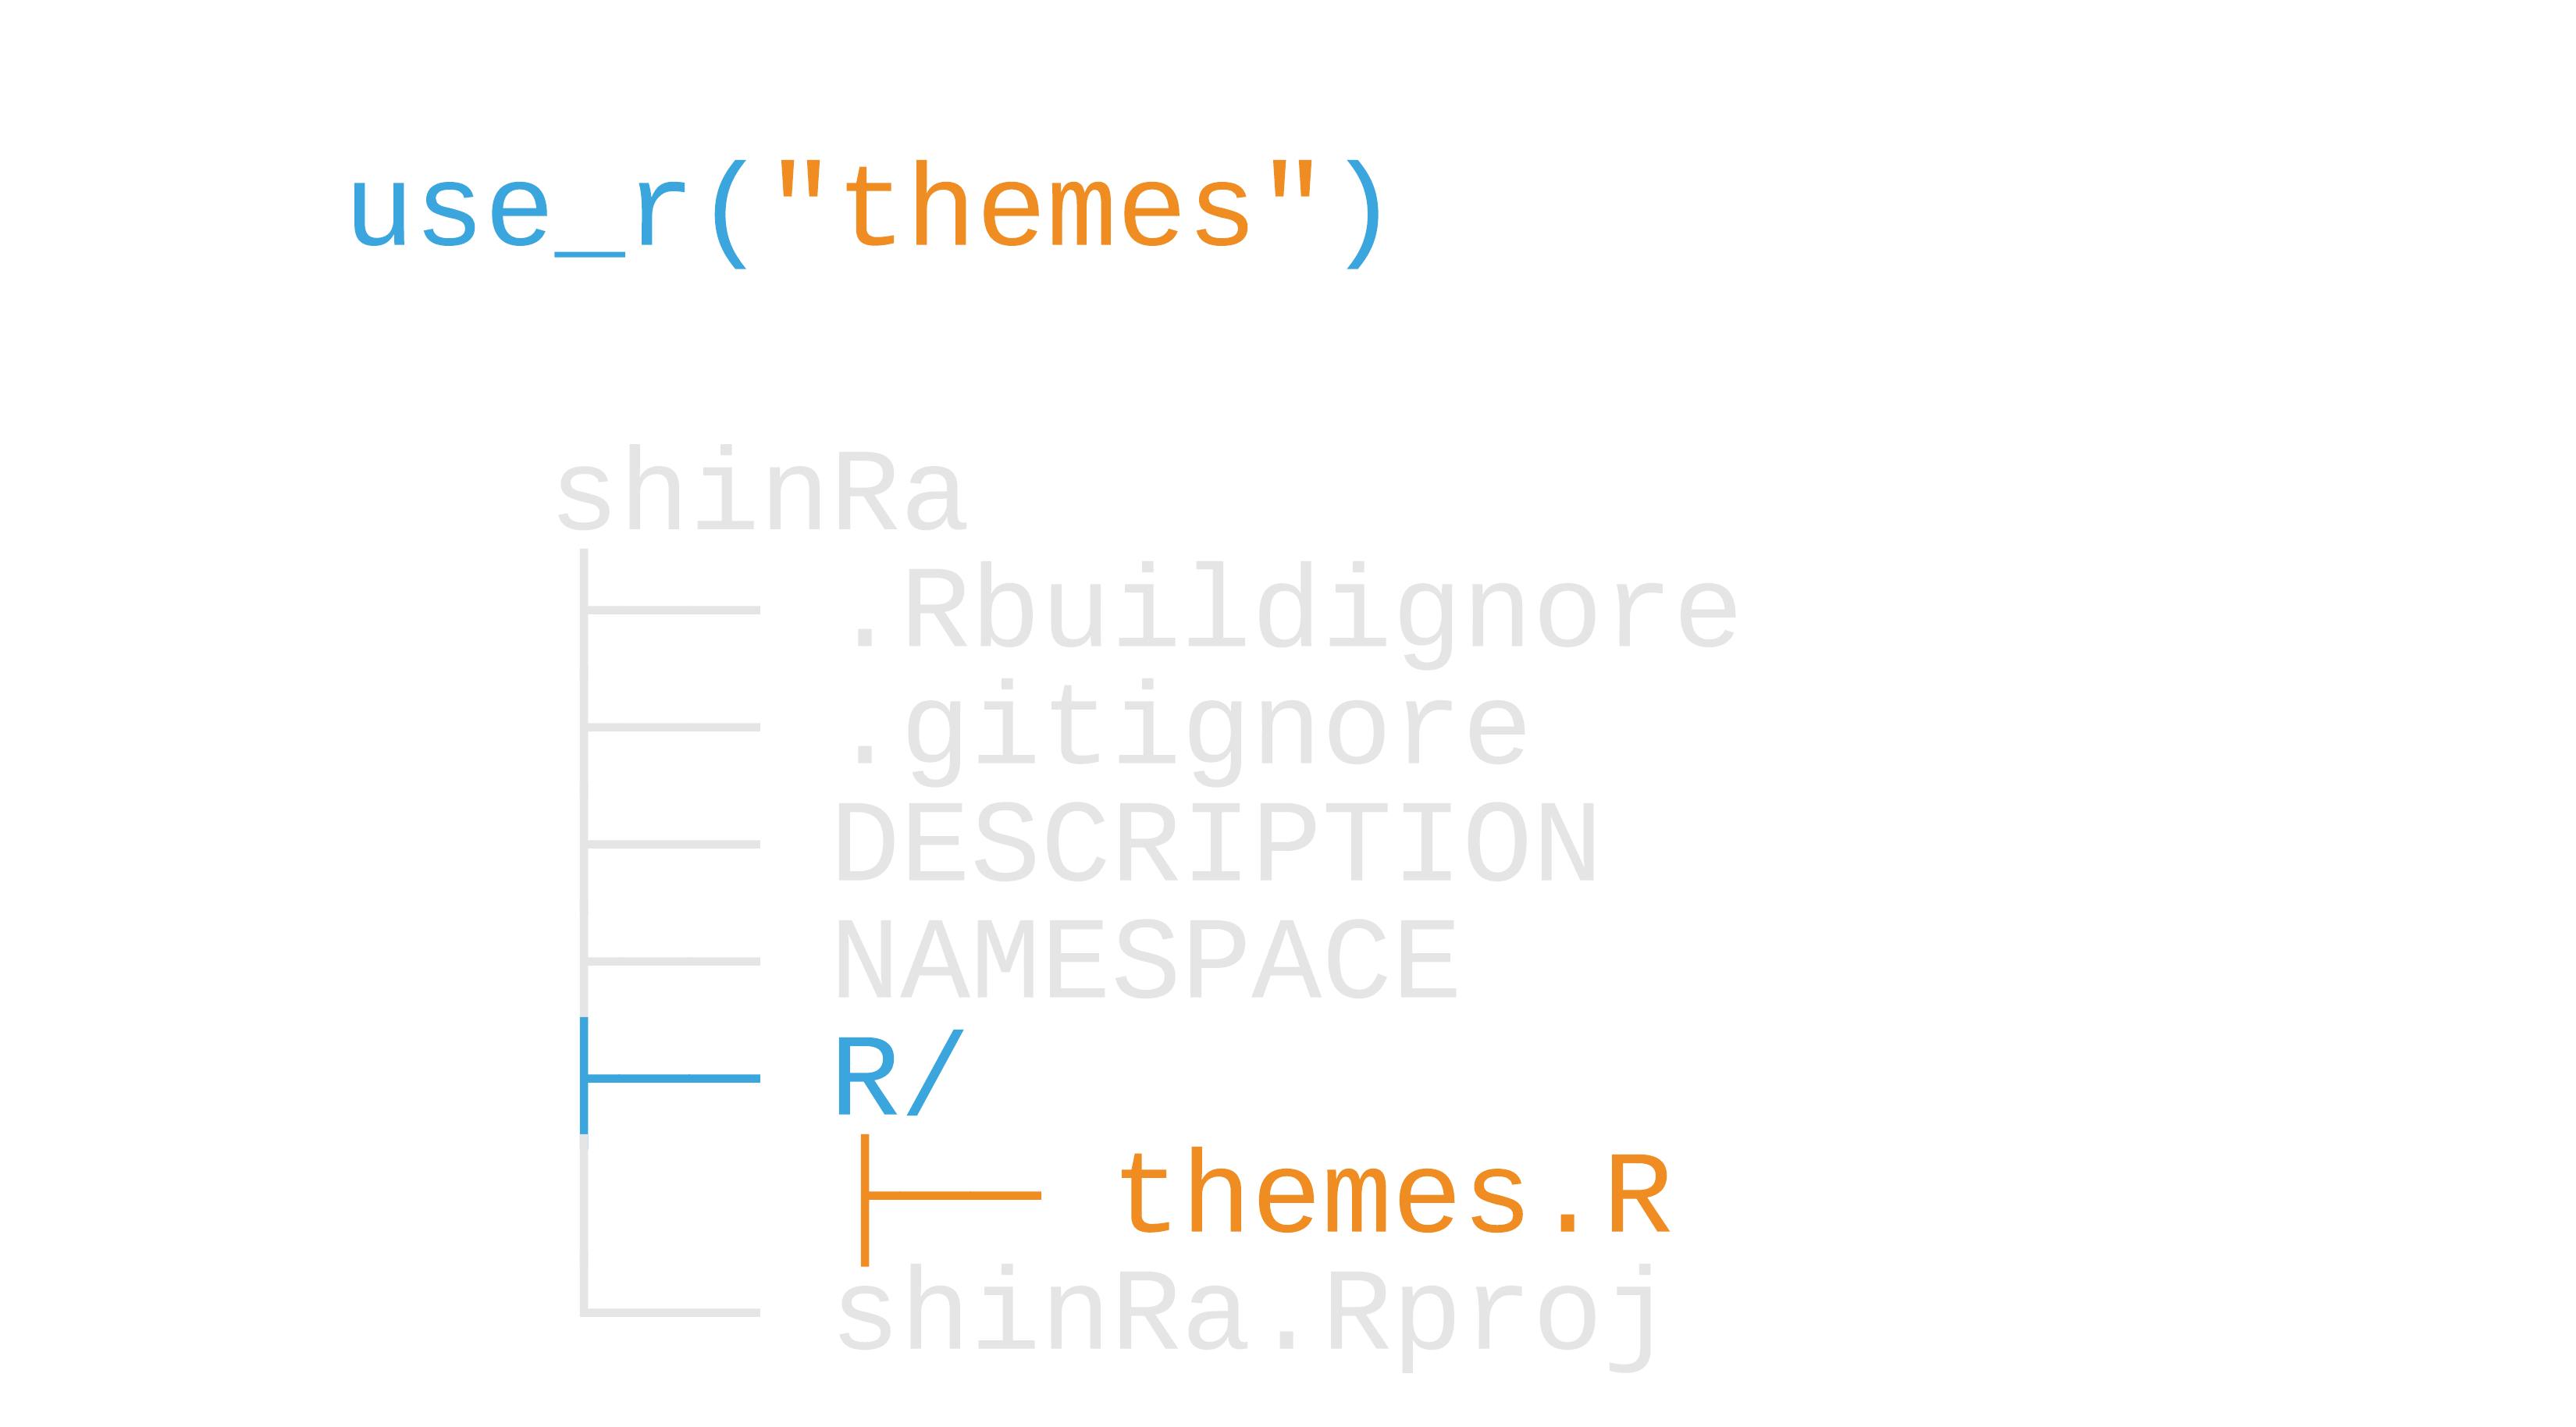
We're going to start writing functions to our package, not the global environment. This will require a change in workflow!
11 / 44
use_r("file_name")
12 / 44
use_r("file_name")
Write a new file to R/
12 / 44
13 / 44
14 / 44
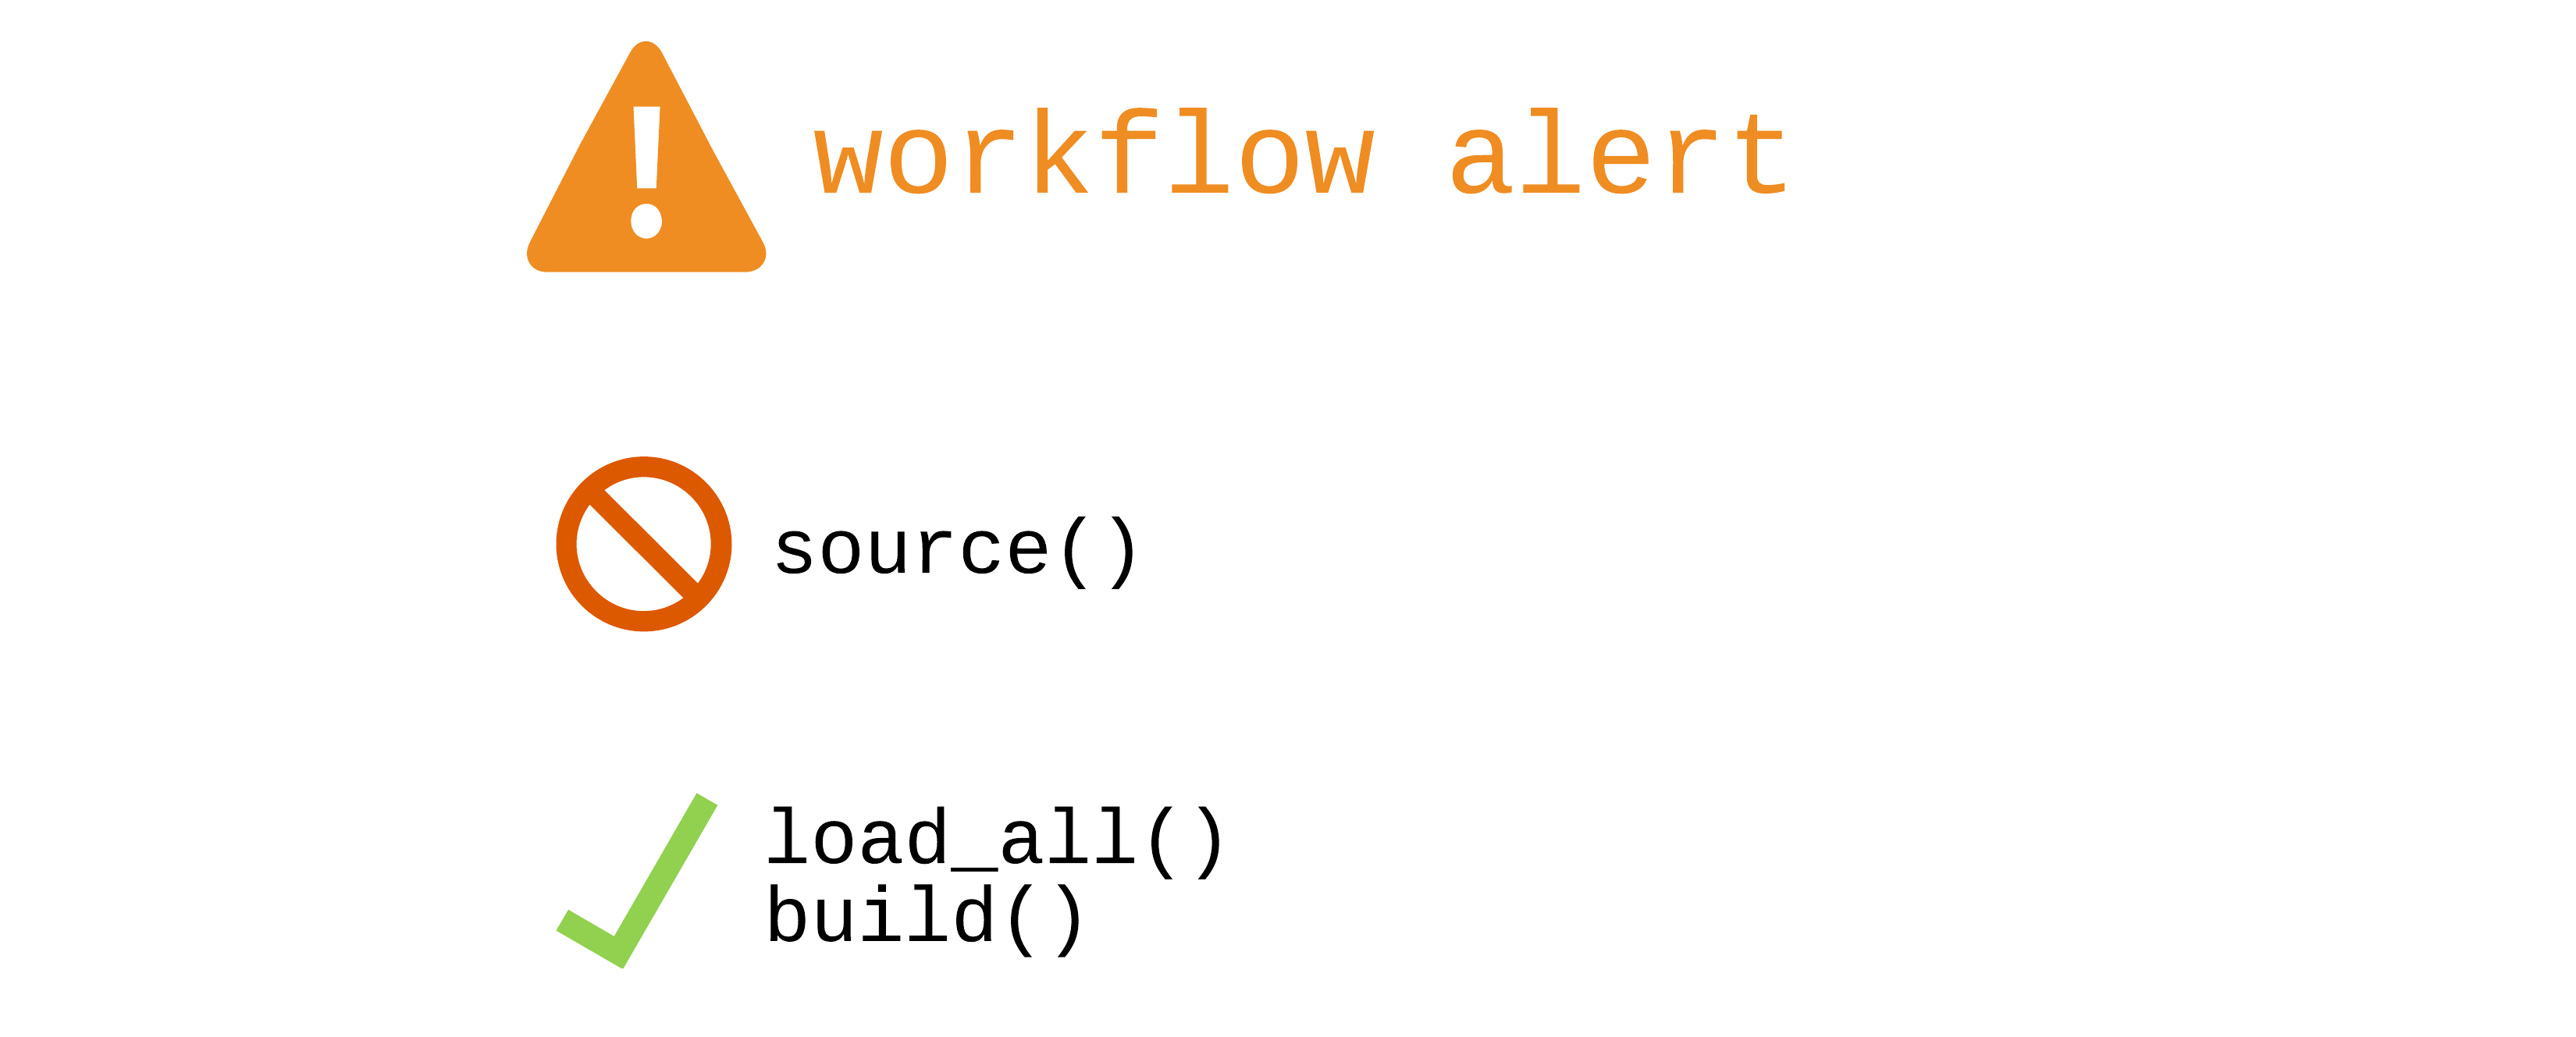
devtools: loading vs. building
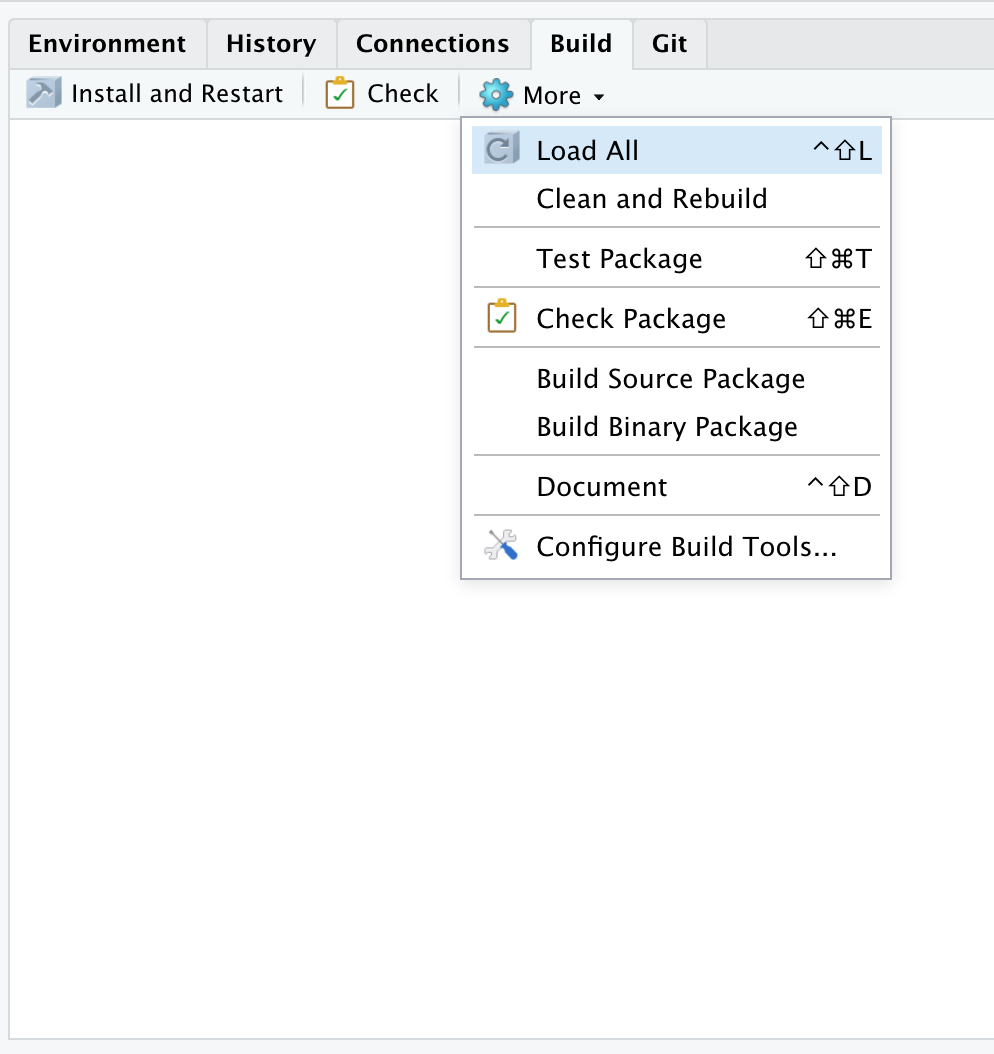
load_all(): fast, all functions available
build(): builds and installs the package
15 / 44
devtools: loading vs. building
load_all(): fast, all functions available
load_all(): fast, all functions availablebuild(): builds and installs the package
build(): builds and installs the packageKeyboard shortcuts
load_all(): CMD/CTRL + Shift + L
build(): CMD/CTRL + Shift + B
16 / 44
17 / 44
Our new workflow

18 / 44
Your Turn 2
Create a new file with use_r() called "db_con"
Put this function in the file and save it
Use load_all() to load the package function.
Run this code to make sure it works:
19 / 44
Your Turn 2
use_r("db_con")20 / 44
Your Turn 2
use_r("db_con")in R/db_con.R:
db_con <- function(dbname = "residents_per_sector") { dbname <- match.arg(dbname) # We will set up real database connections later. For now, # we'll just return some hard-coded data instead. data.frame( sector = as.factor(1:8), residents = c(1000, 2034, 4594, 2304, 8093, 1200, 300, 2398) )}20 / 44
Your Turn 2

21 / 44
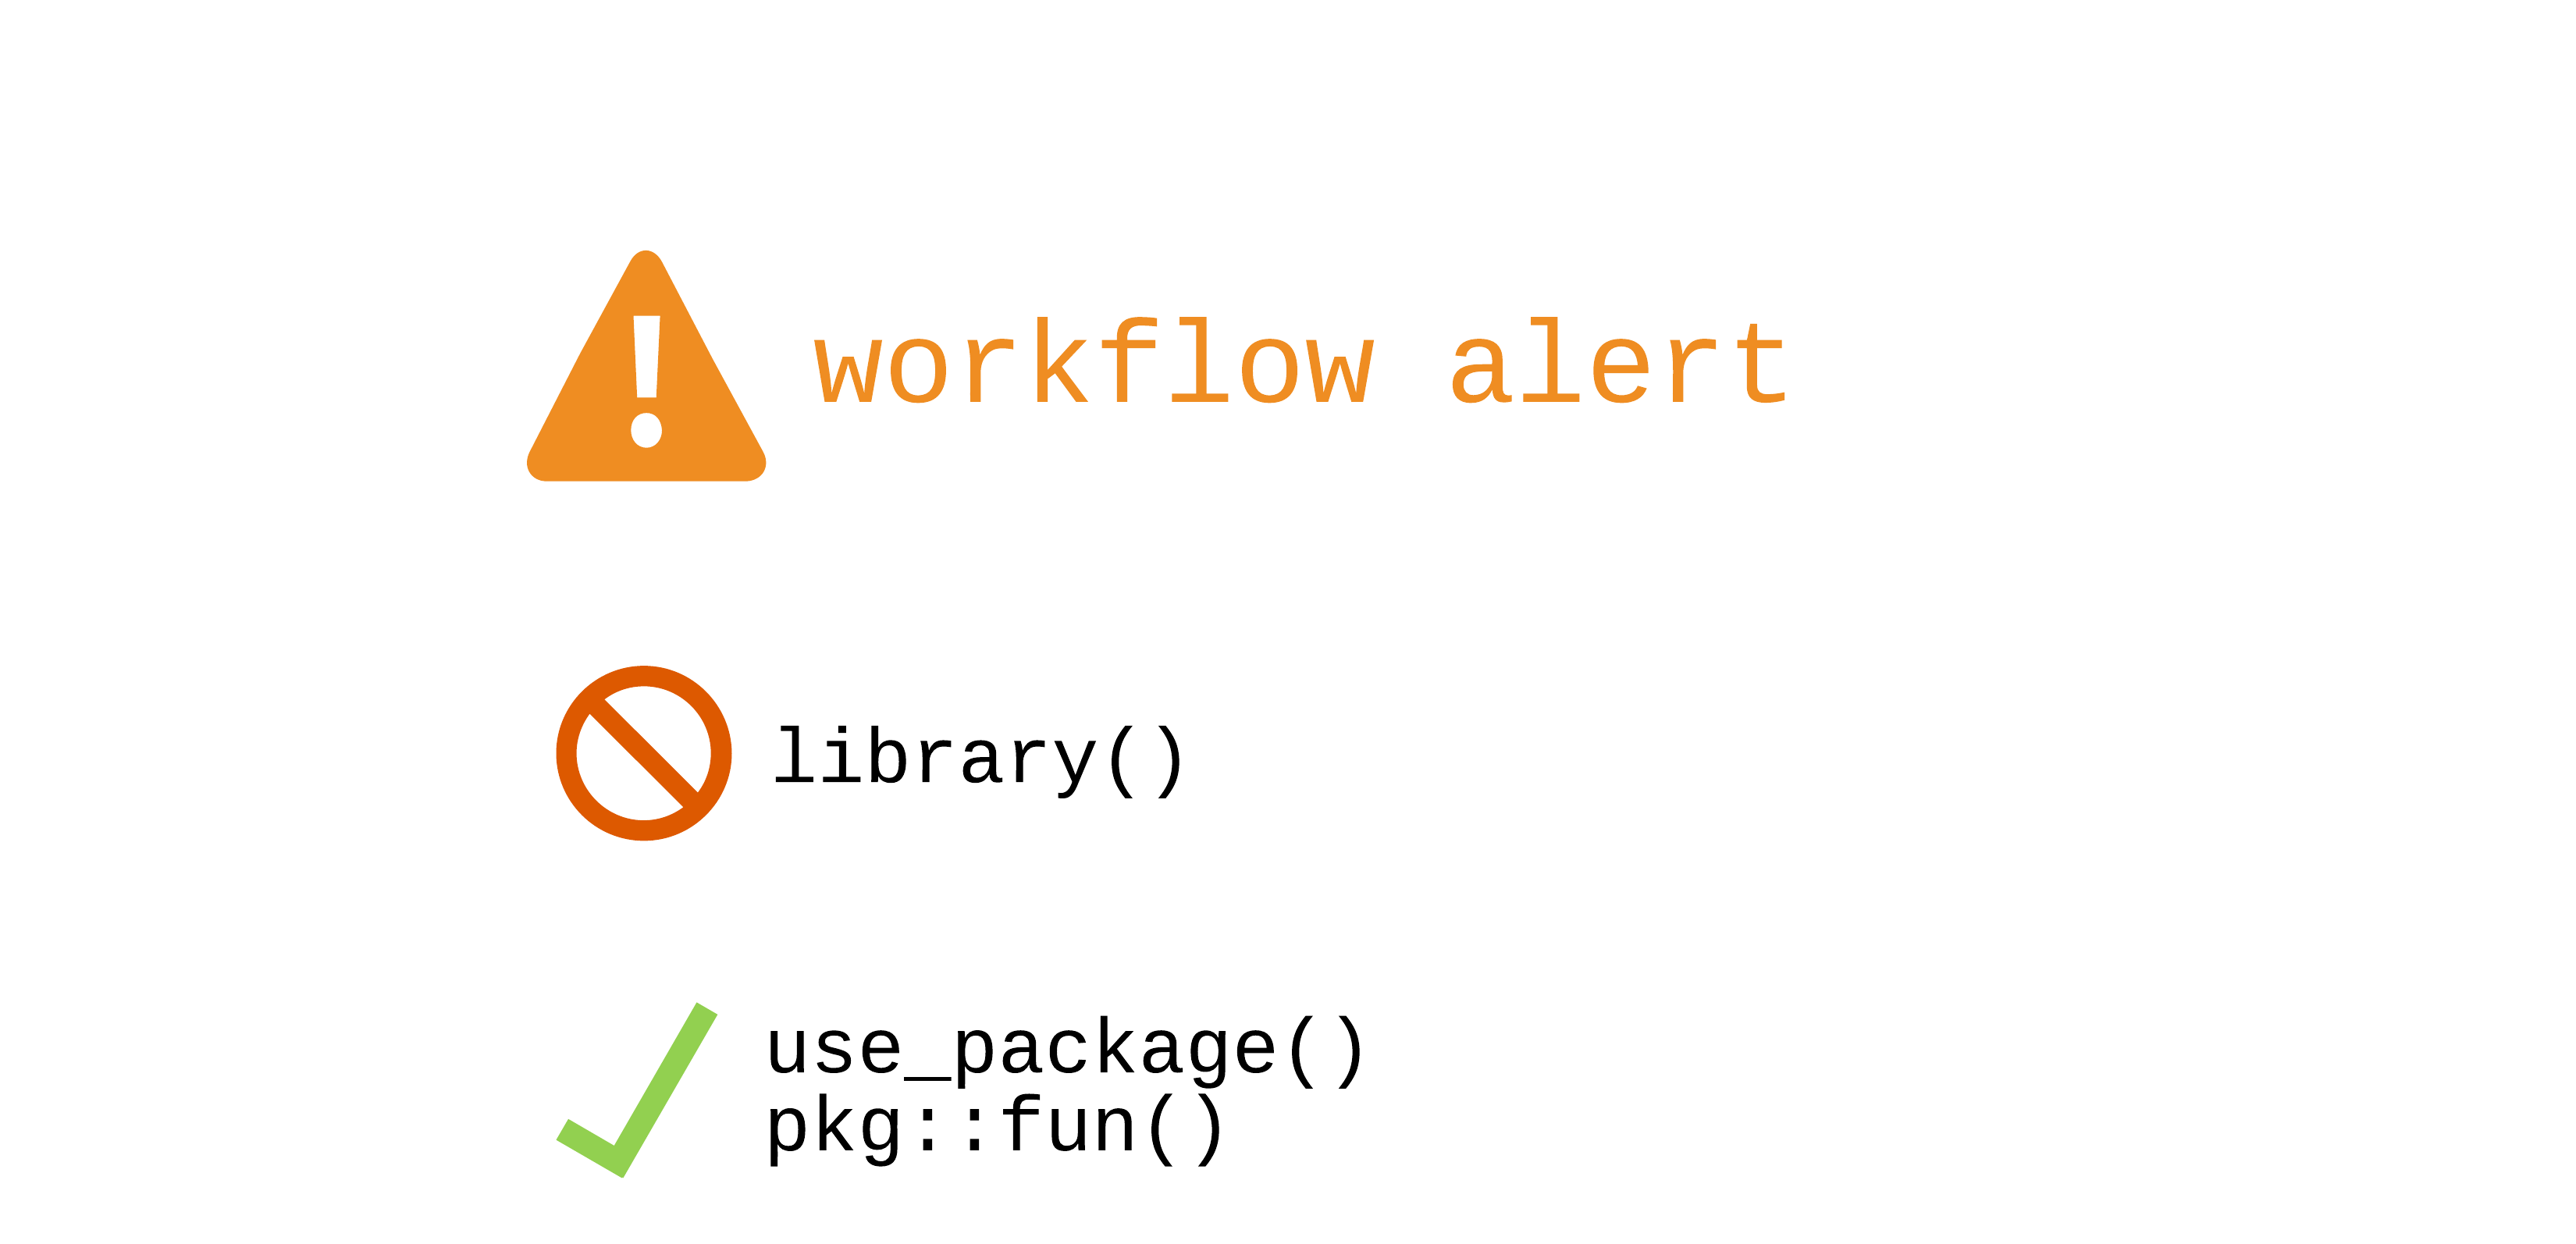
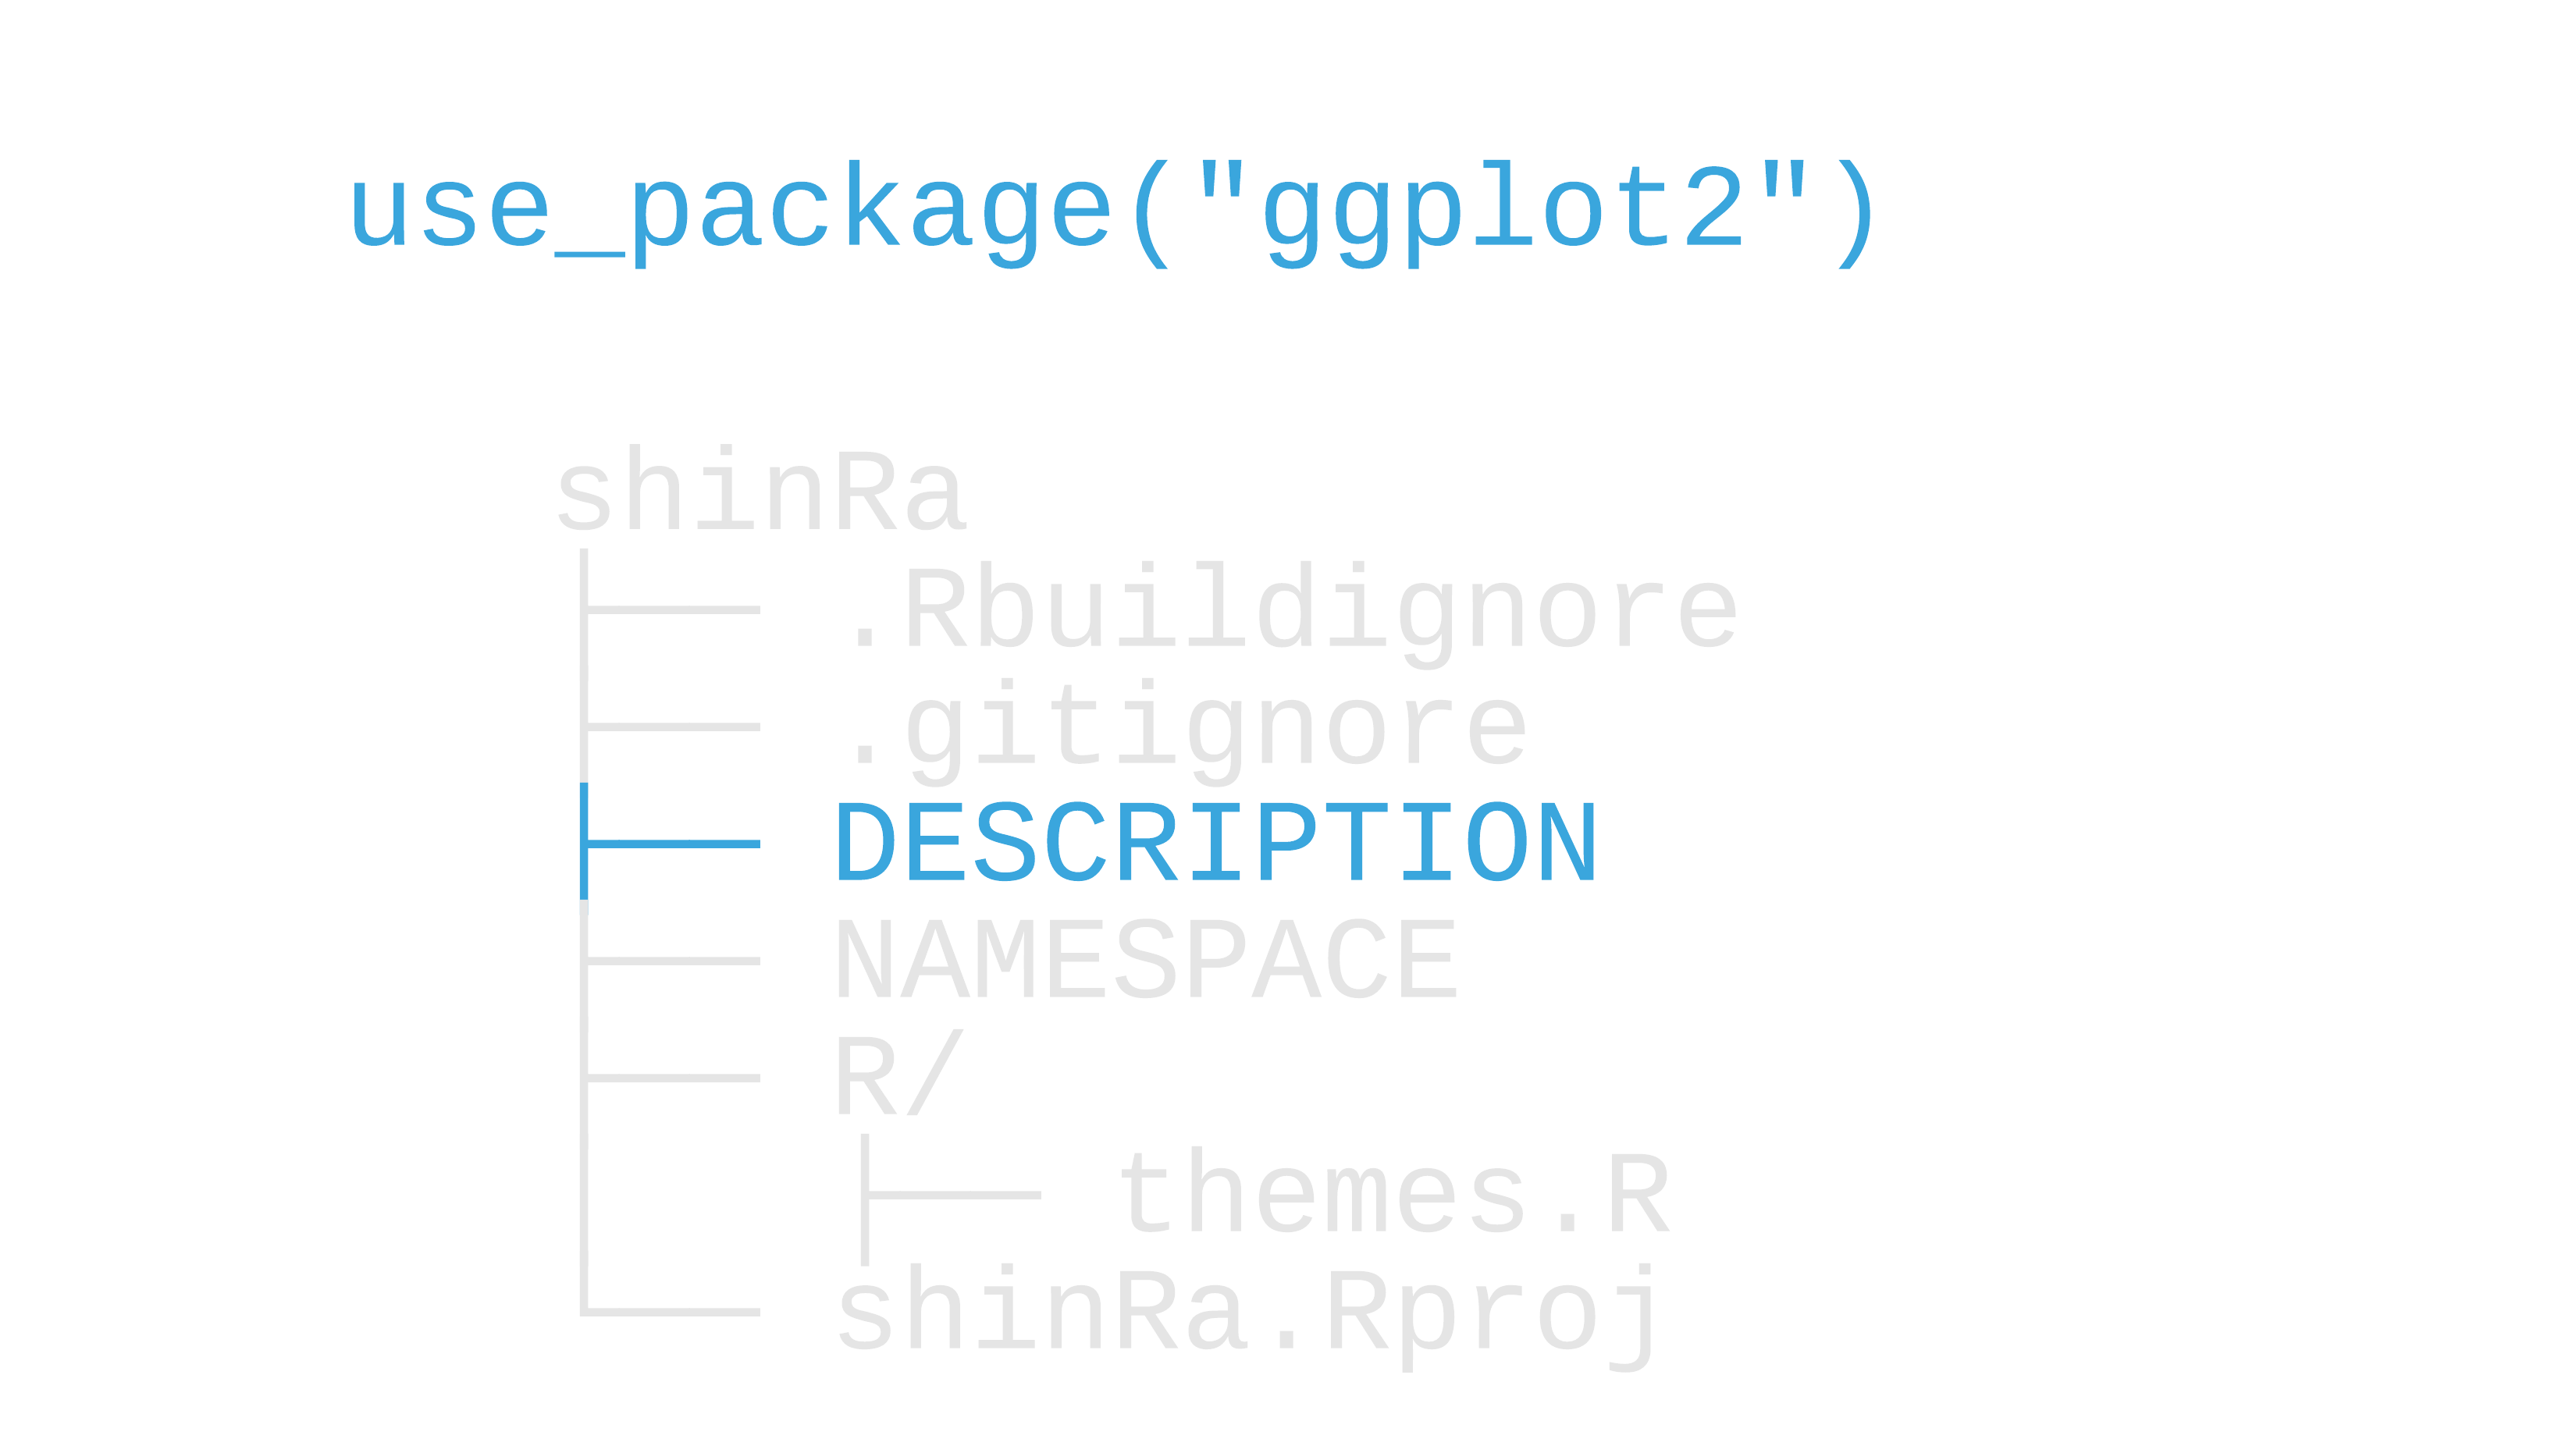
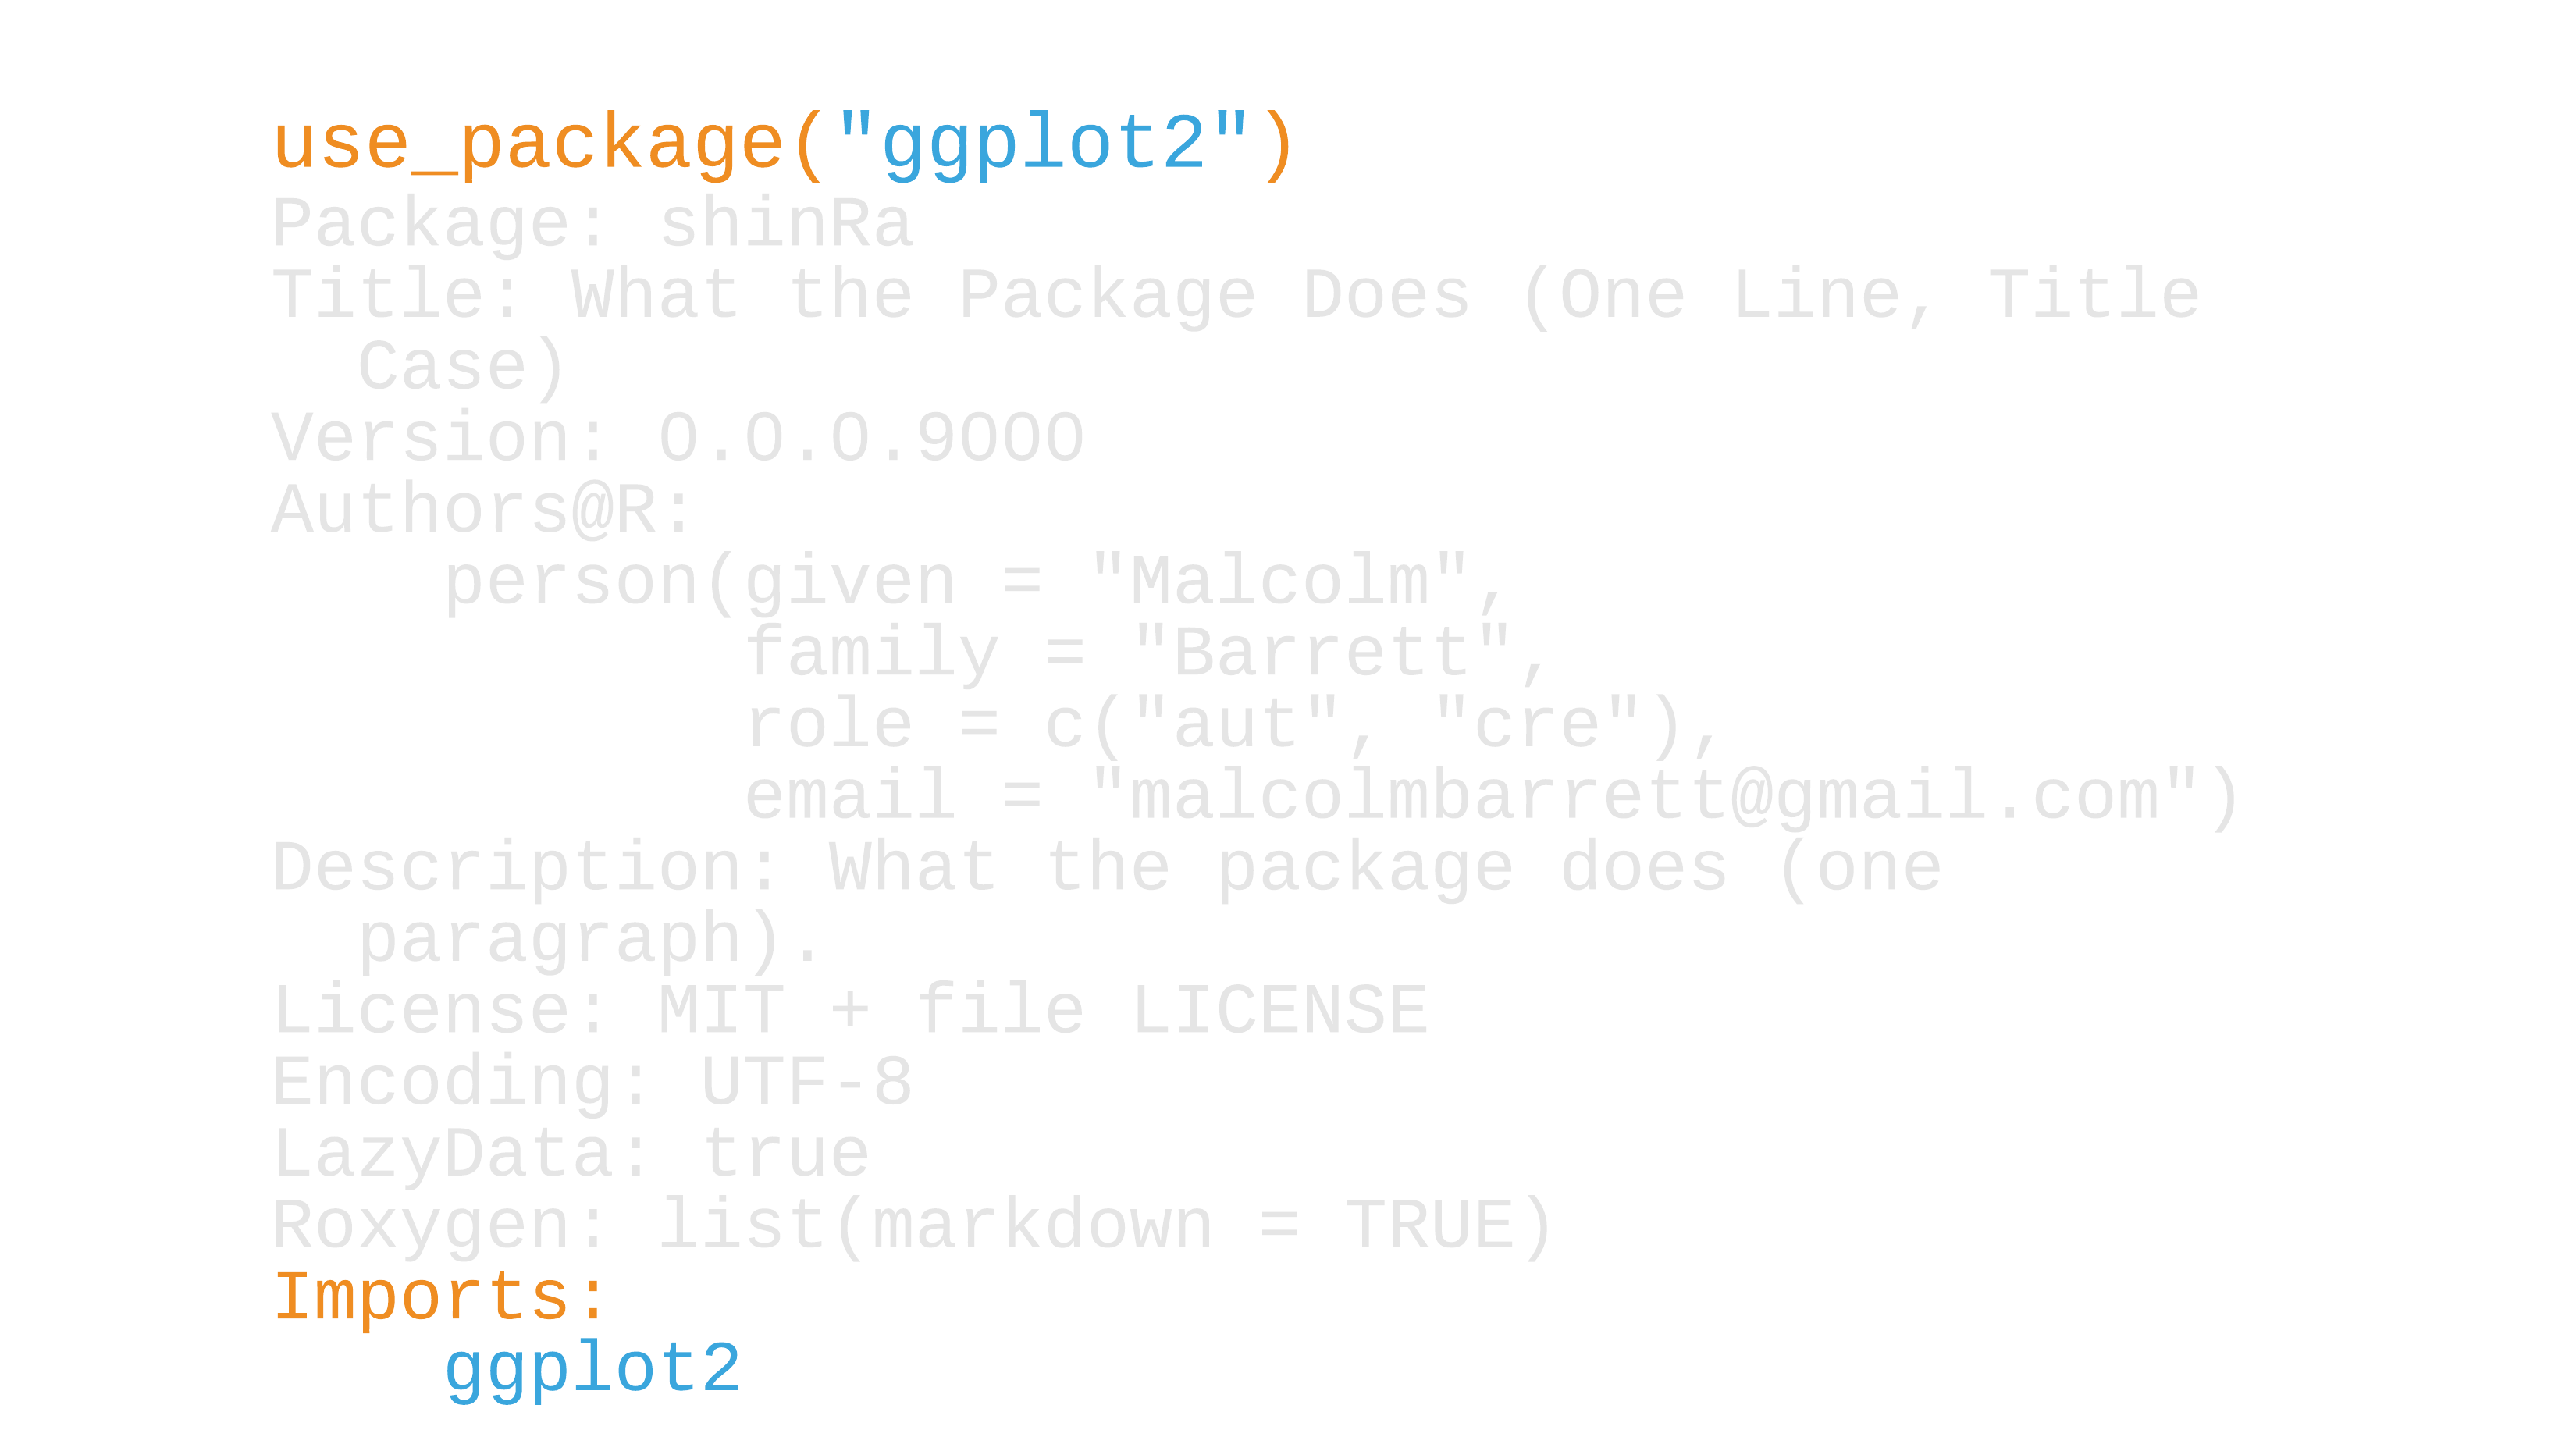
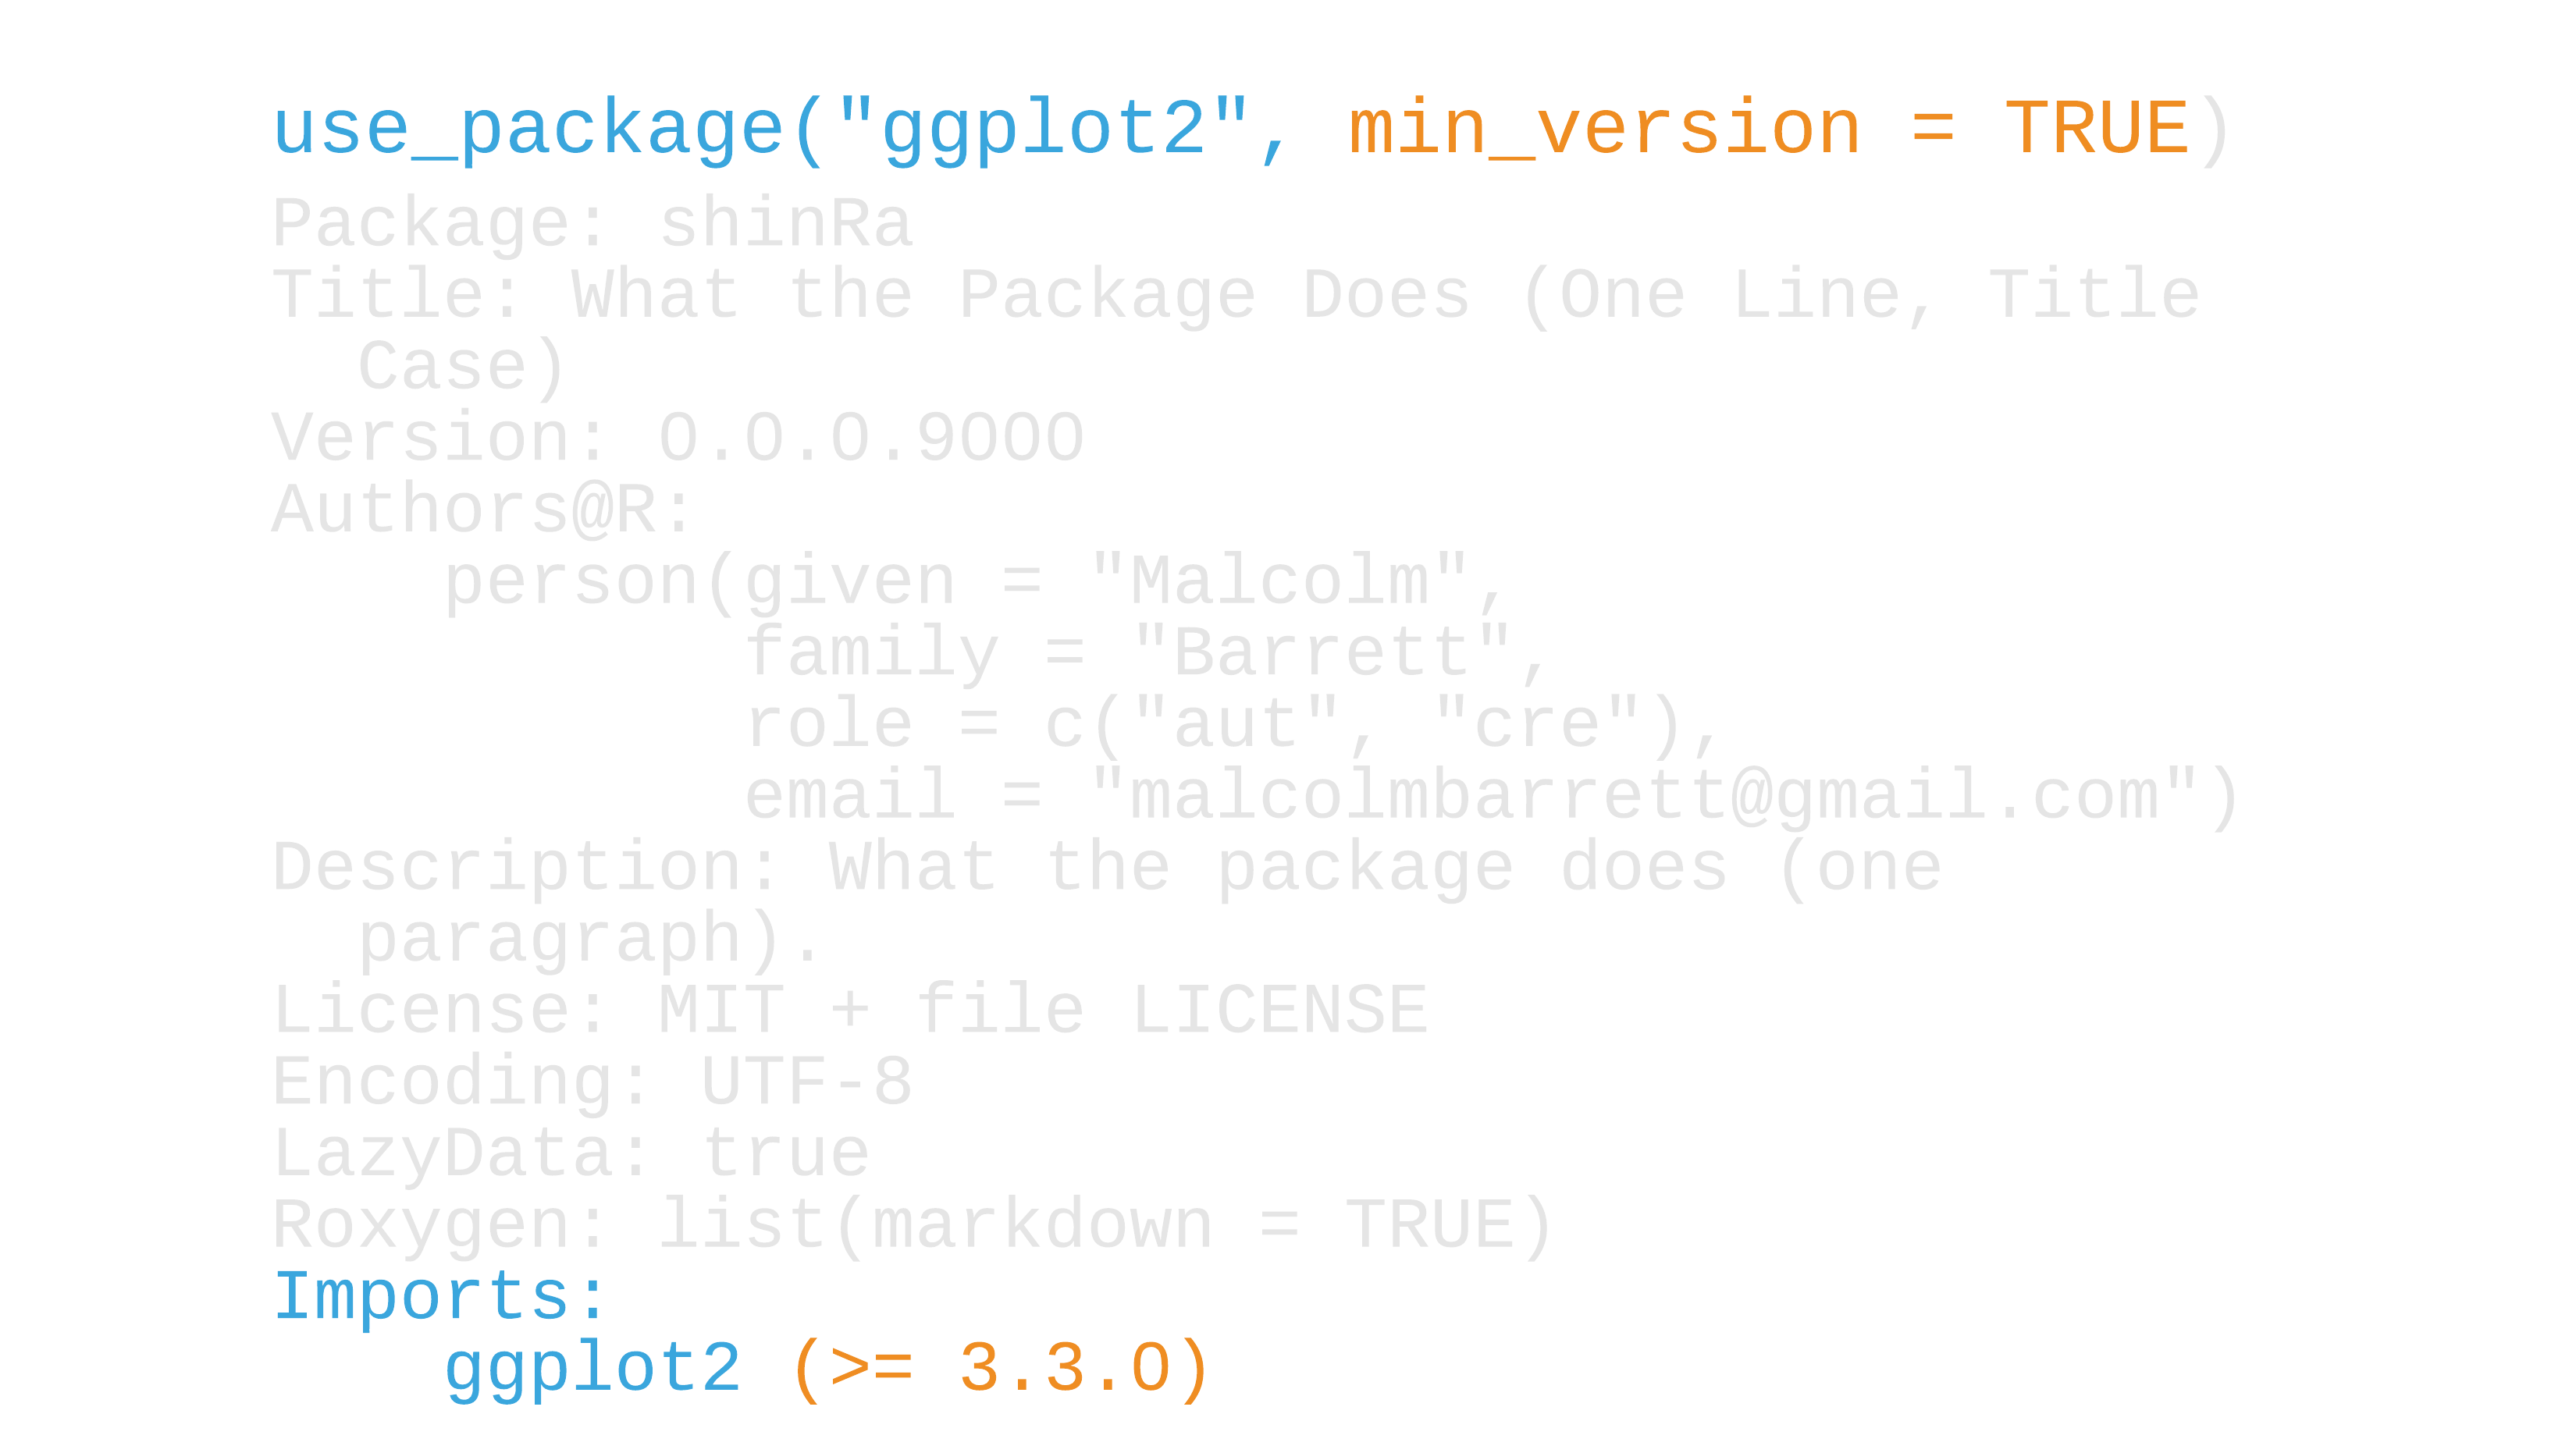
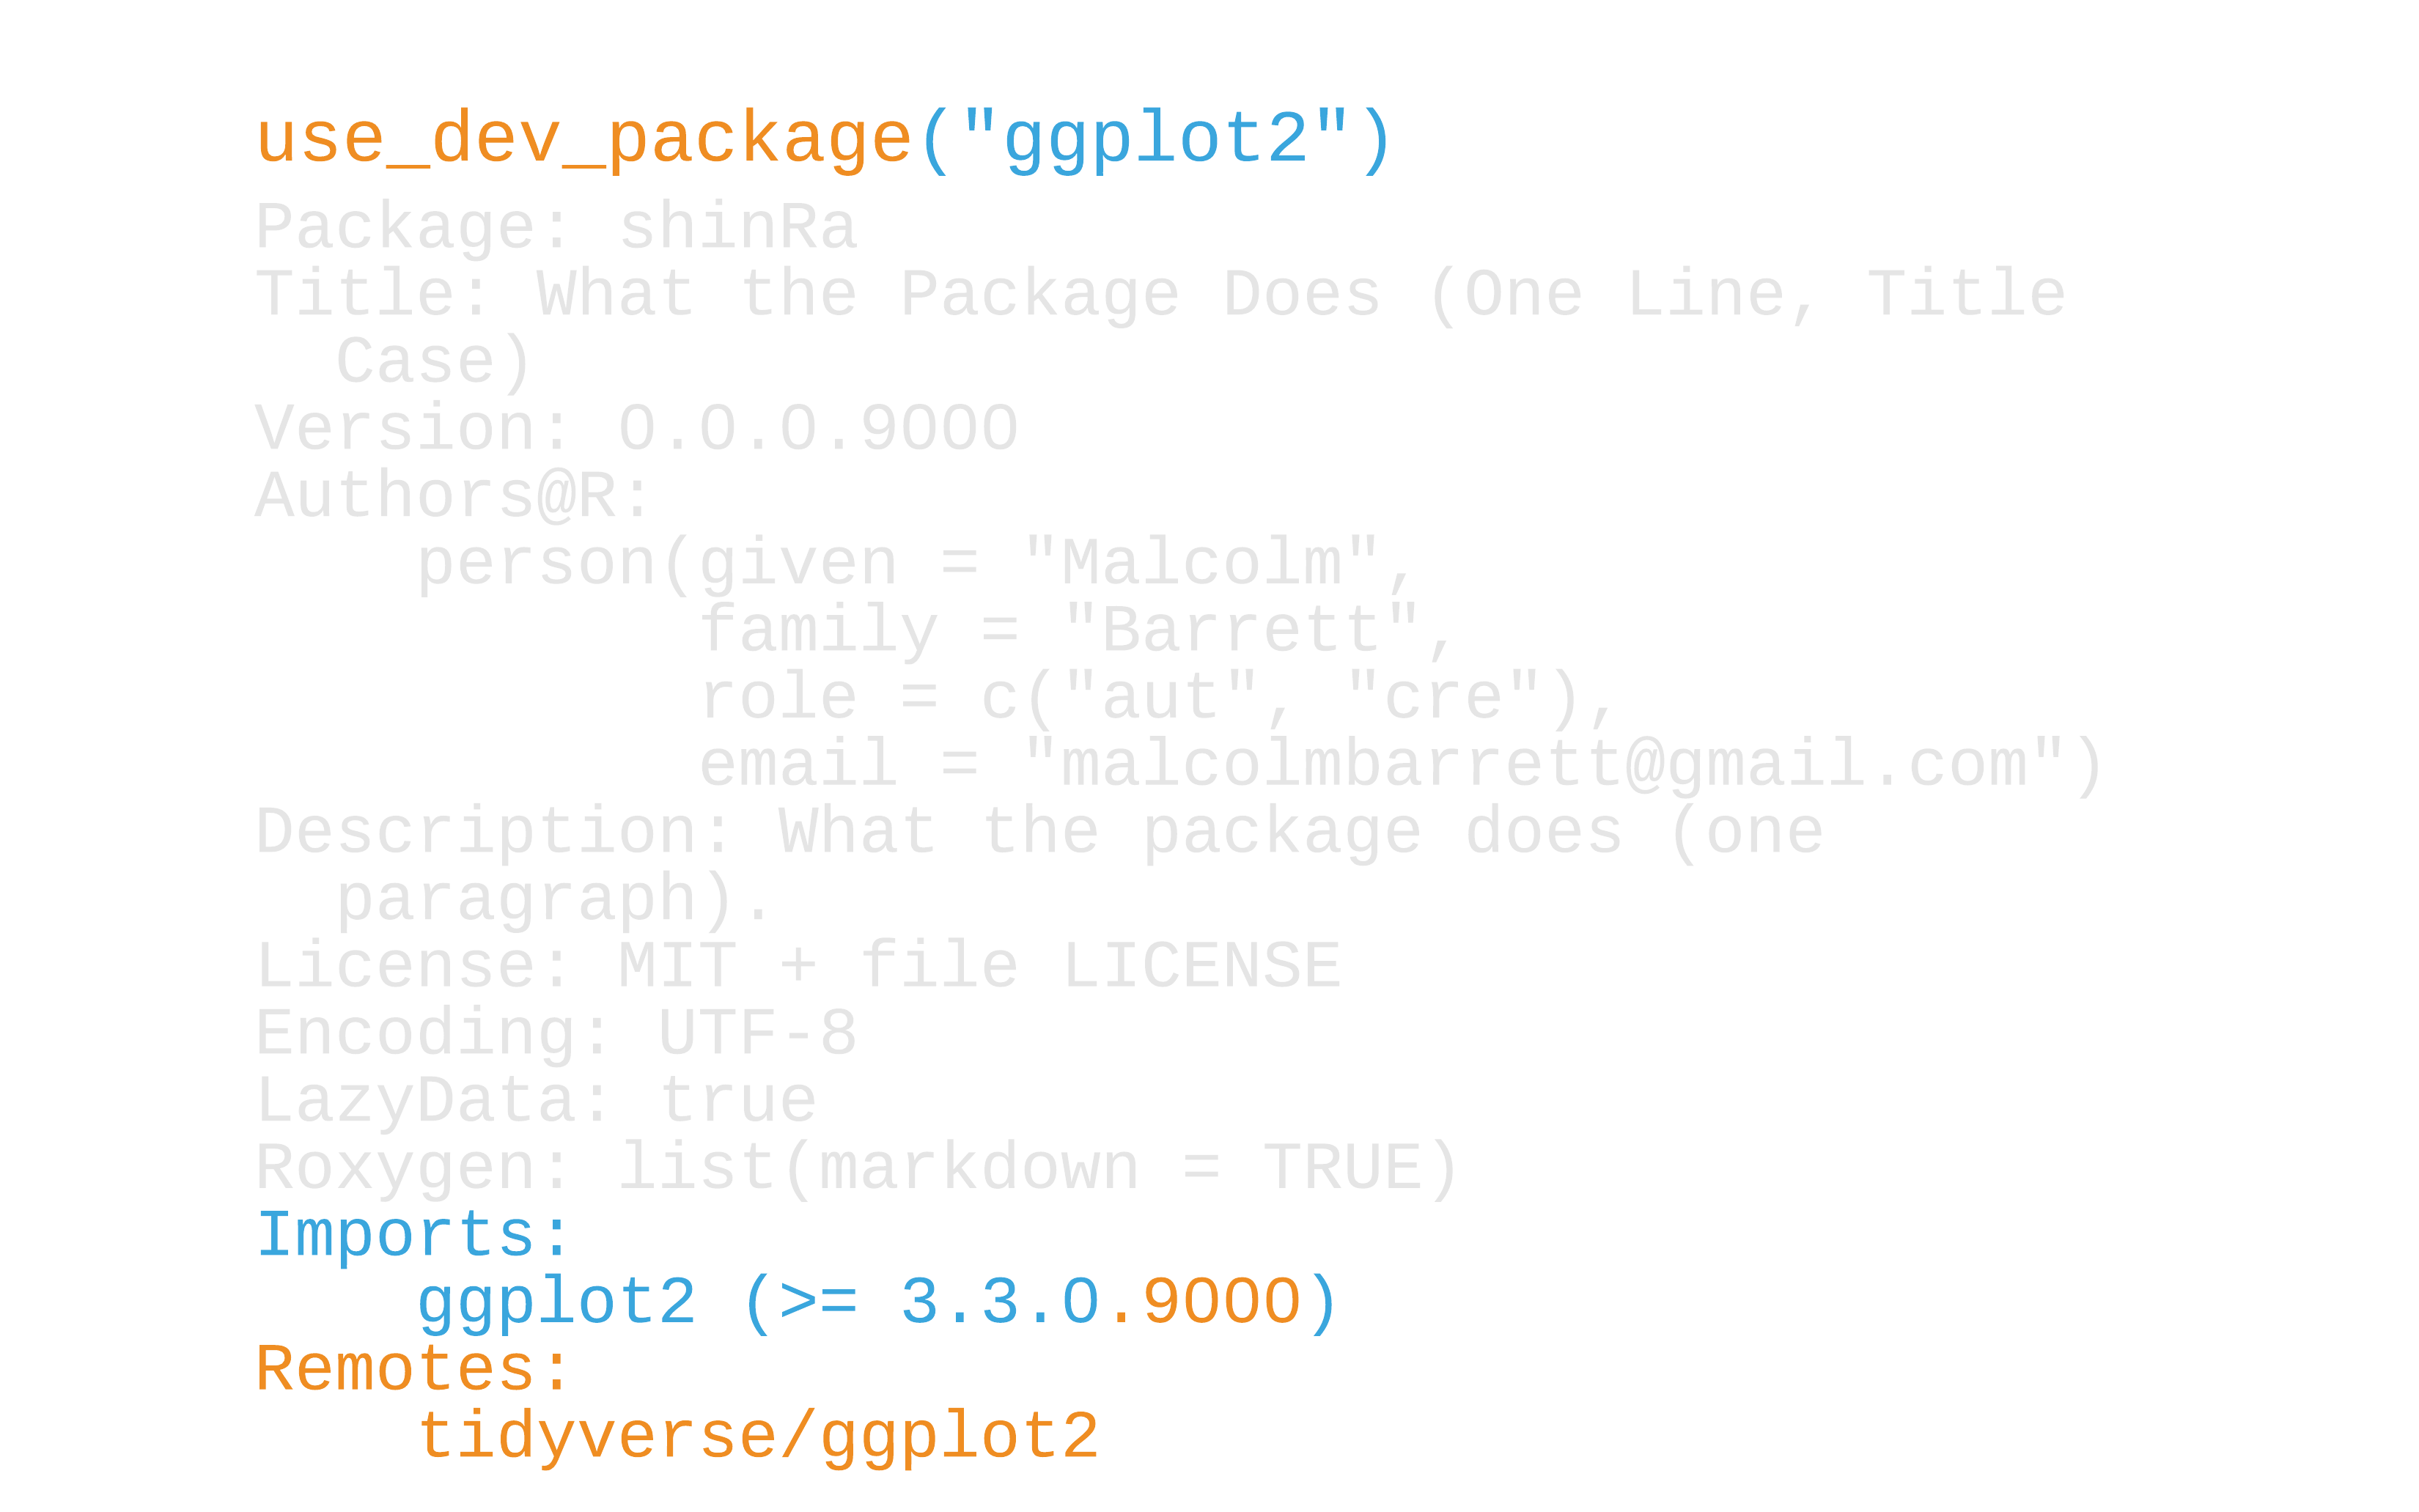
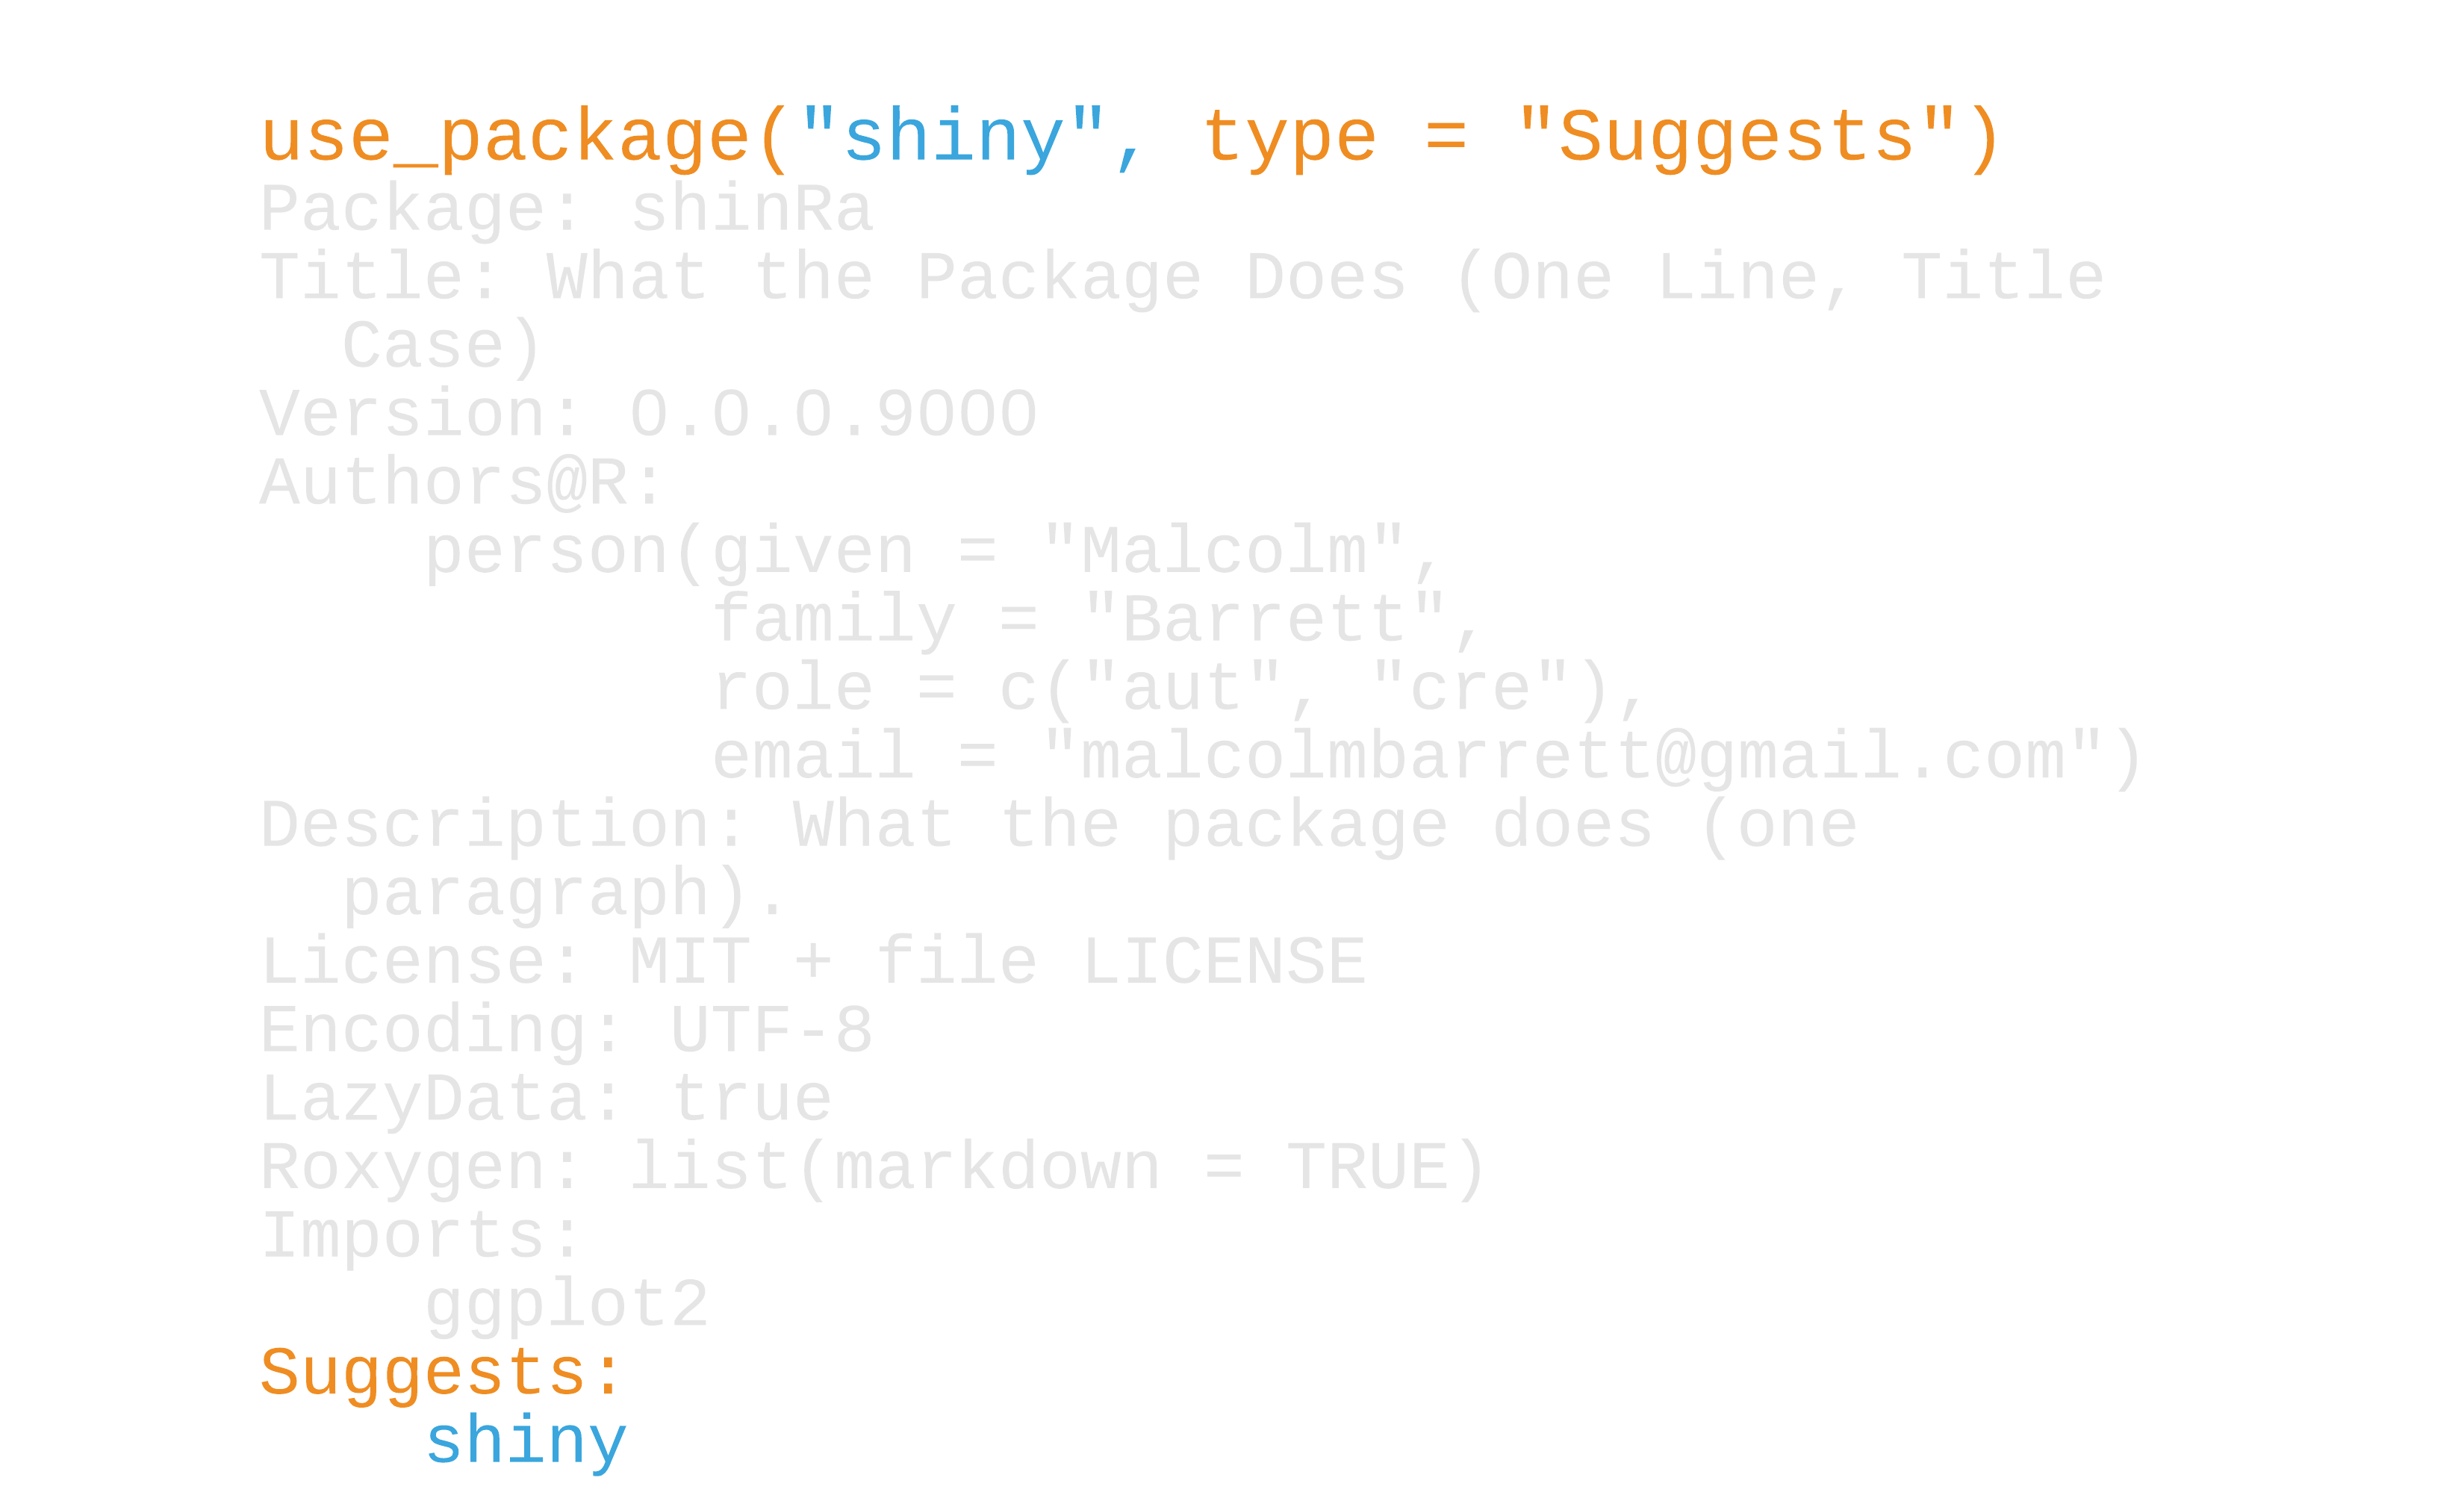
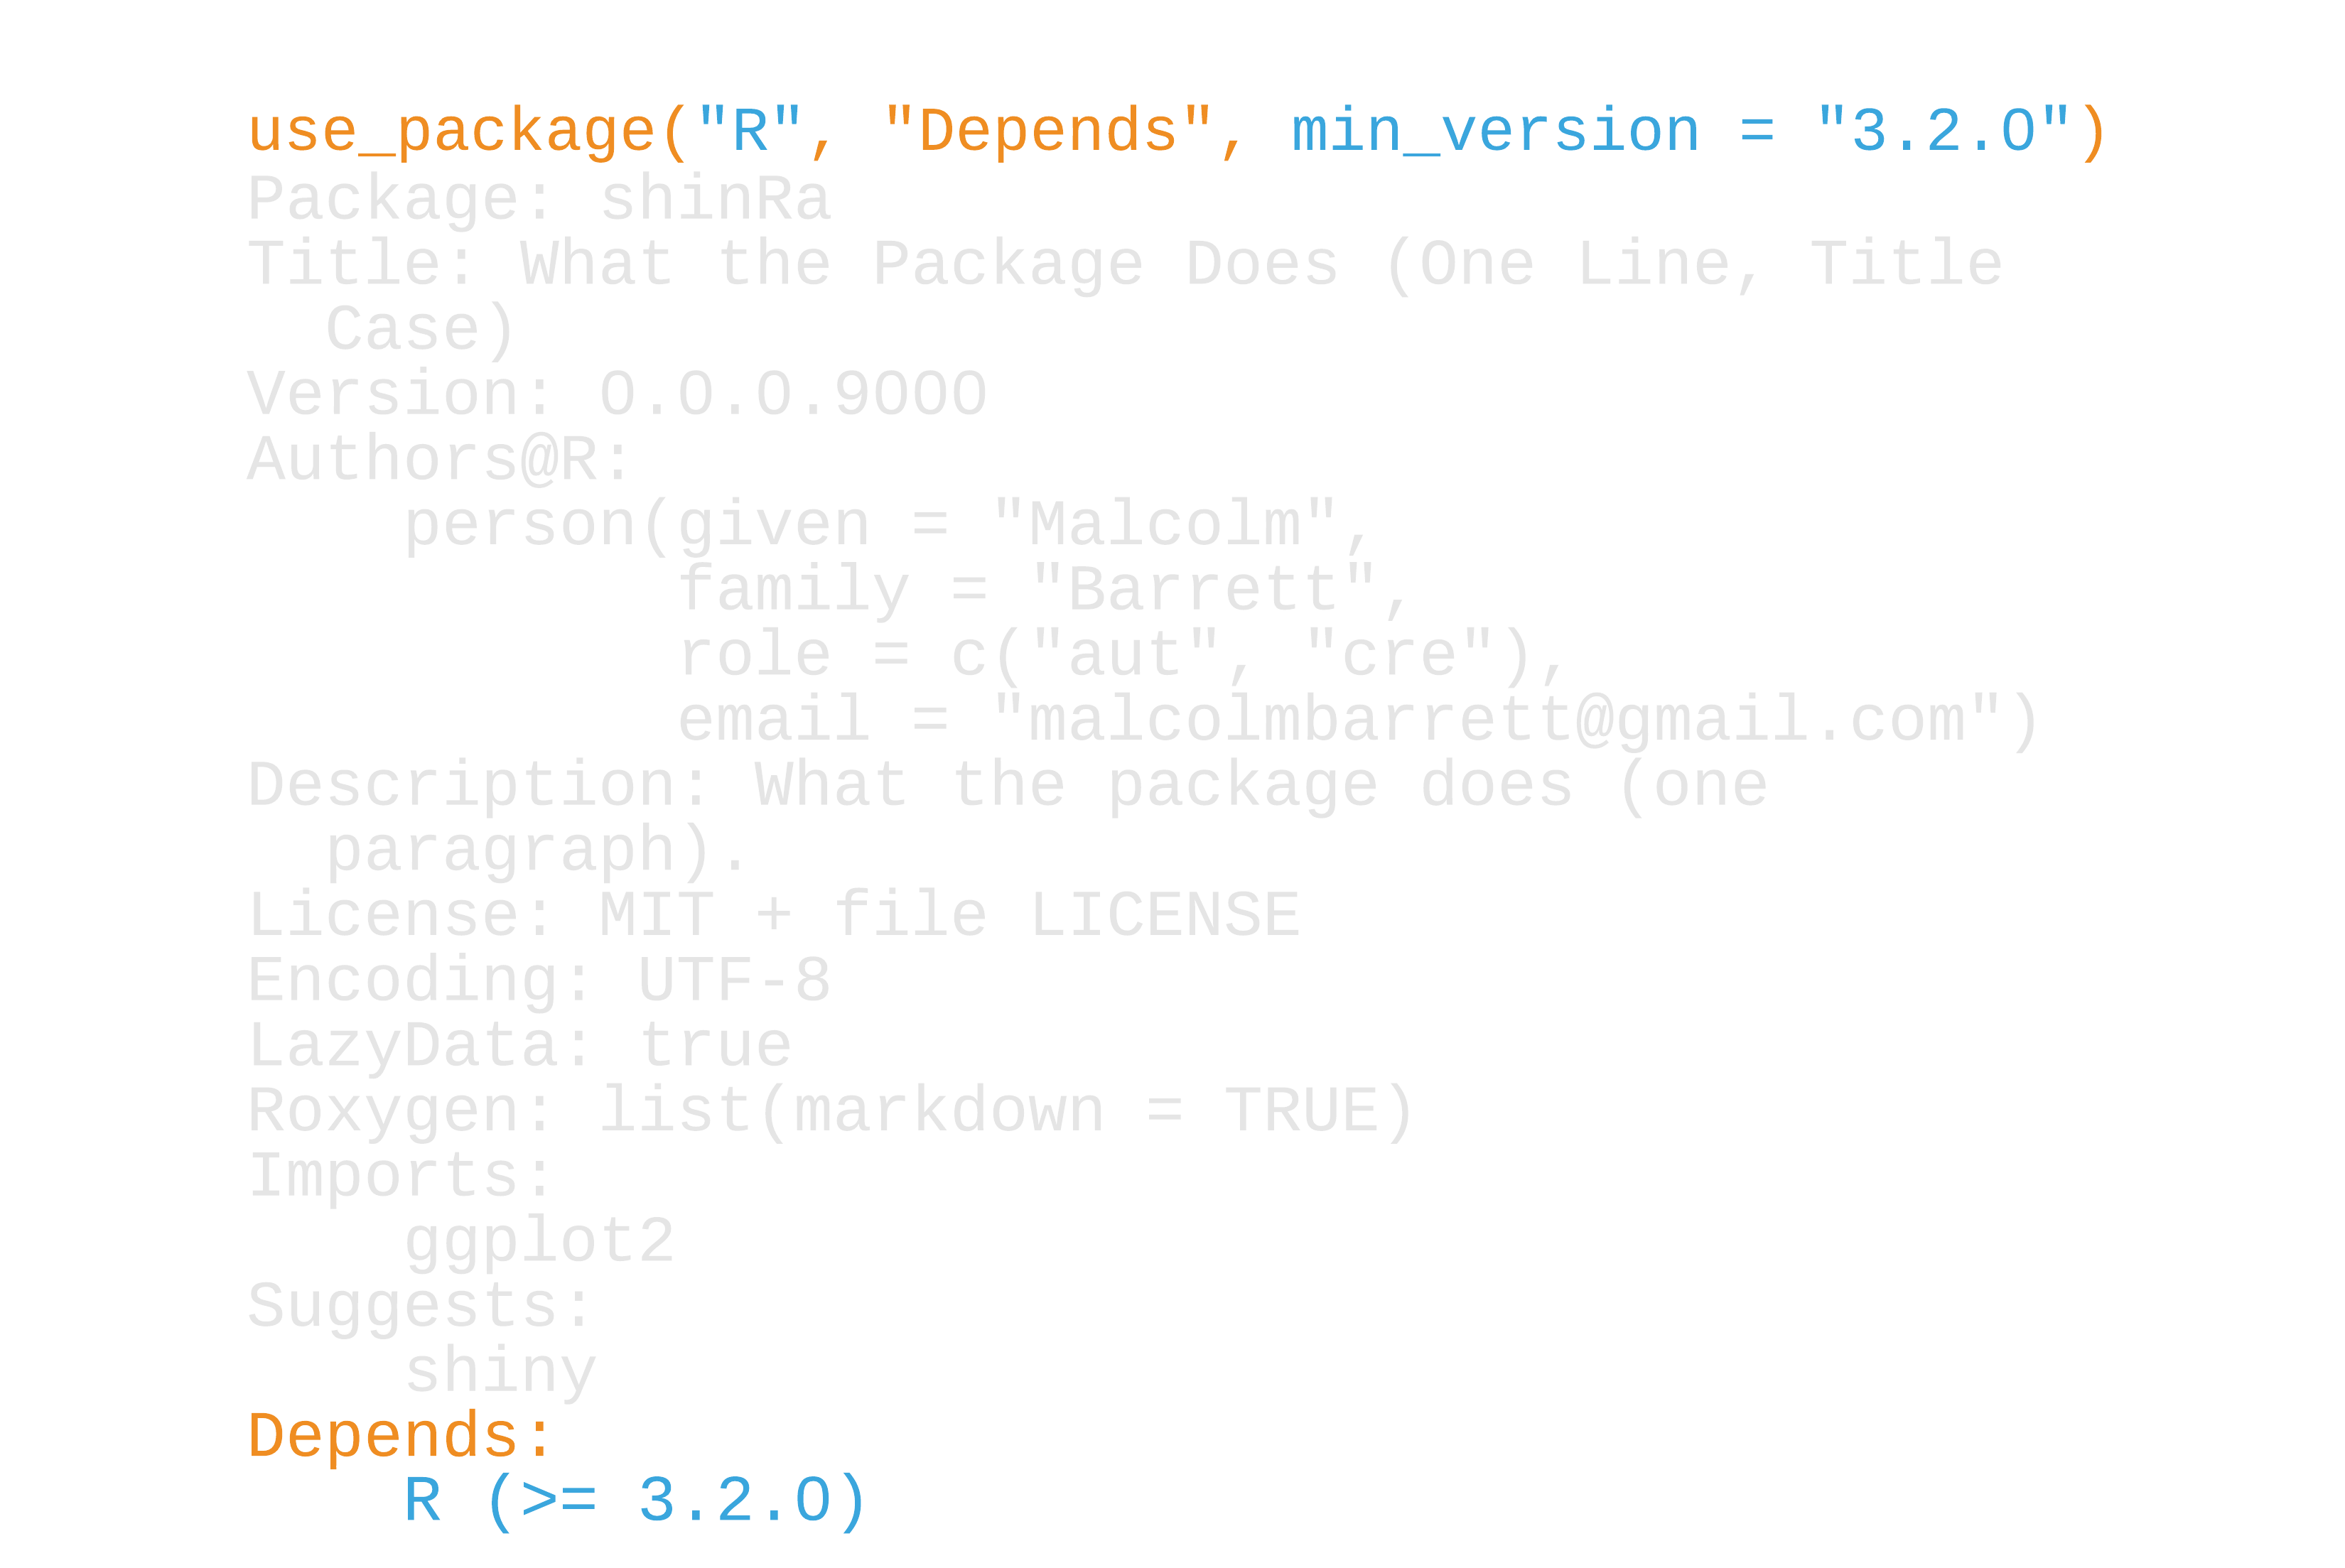
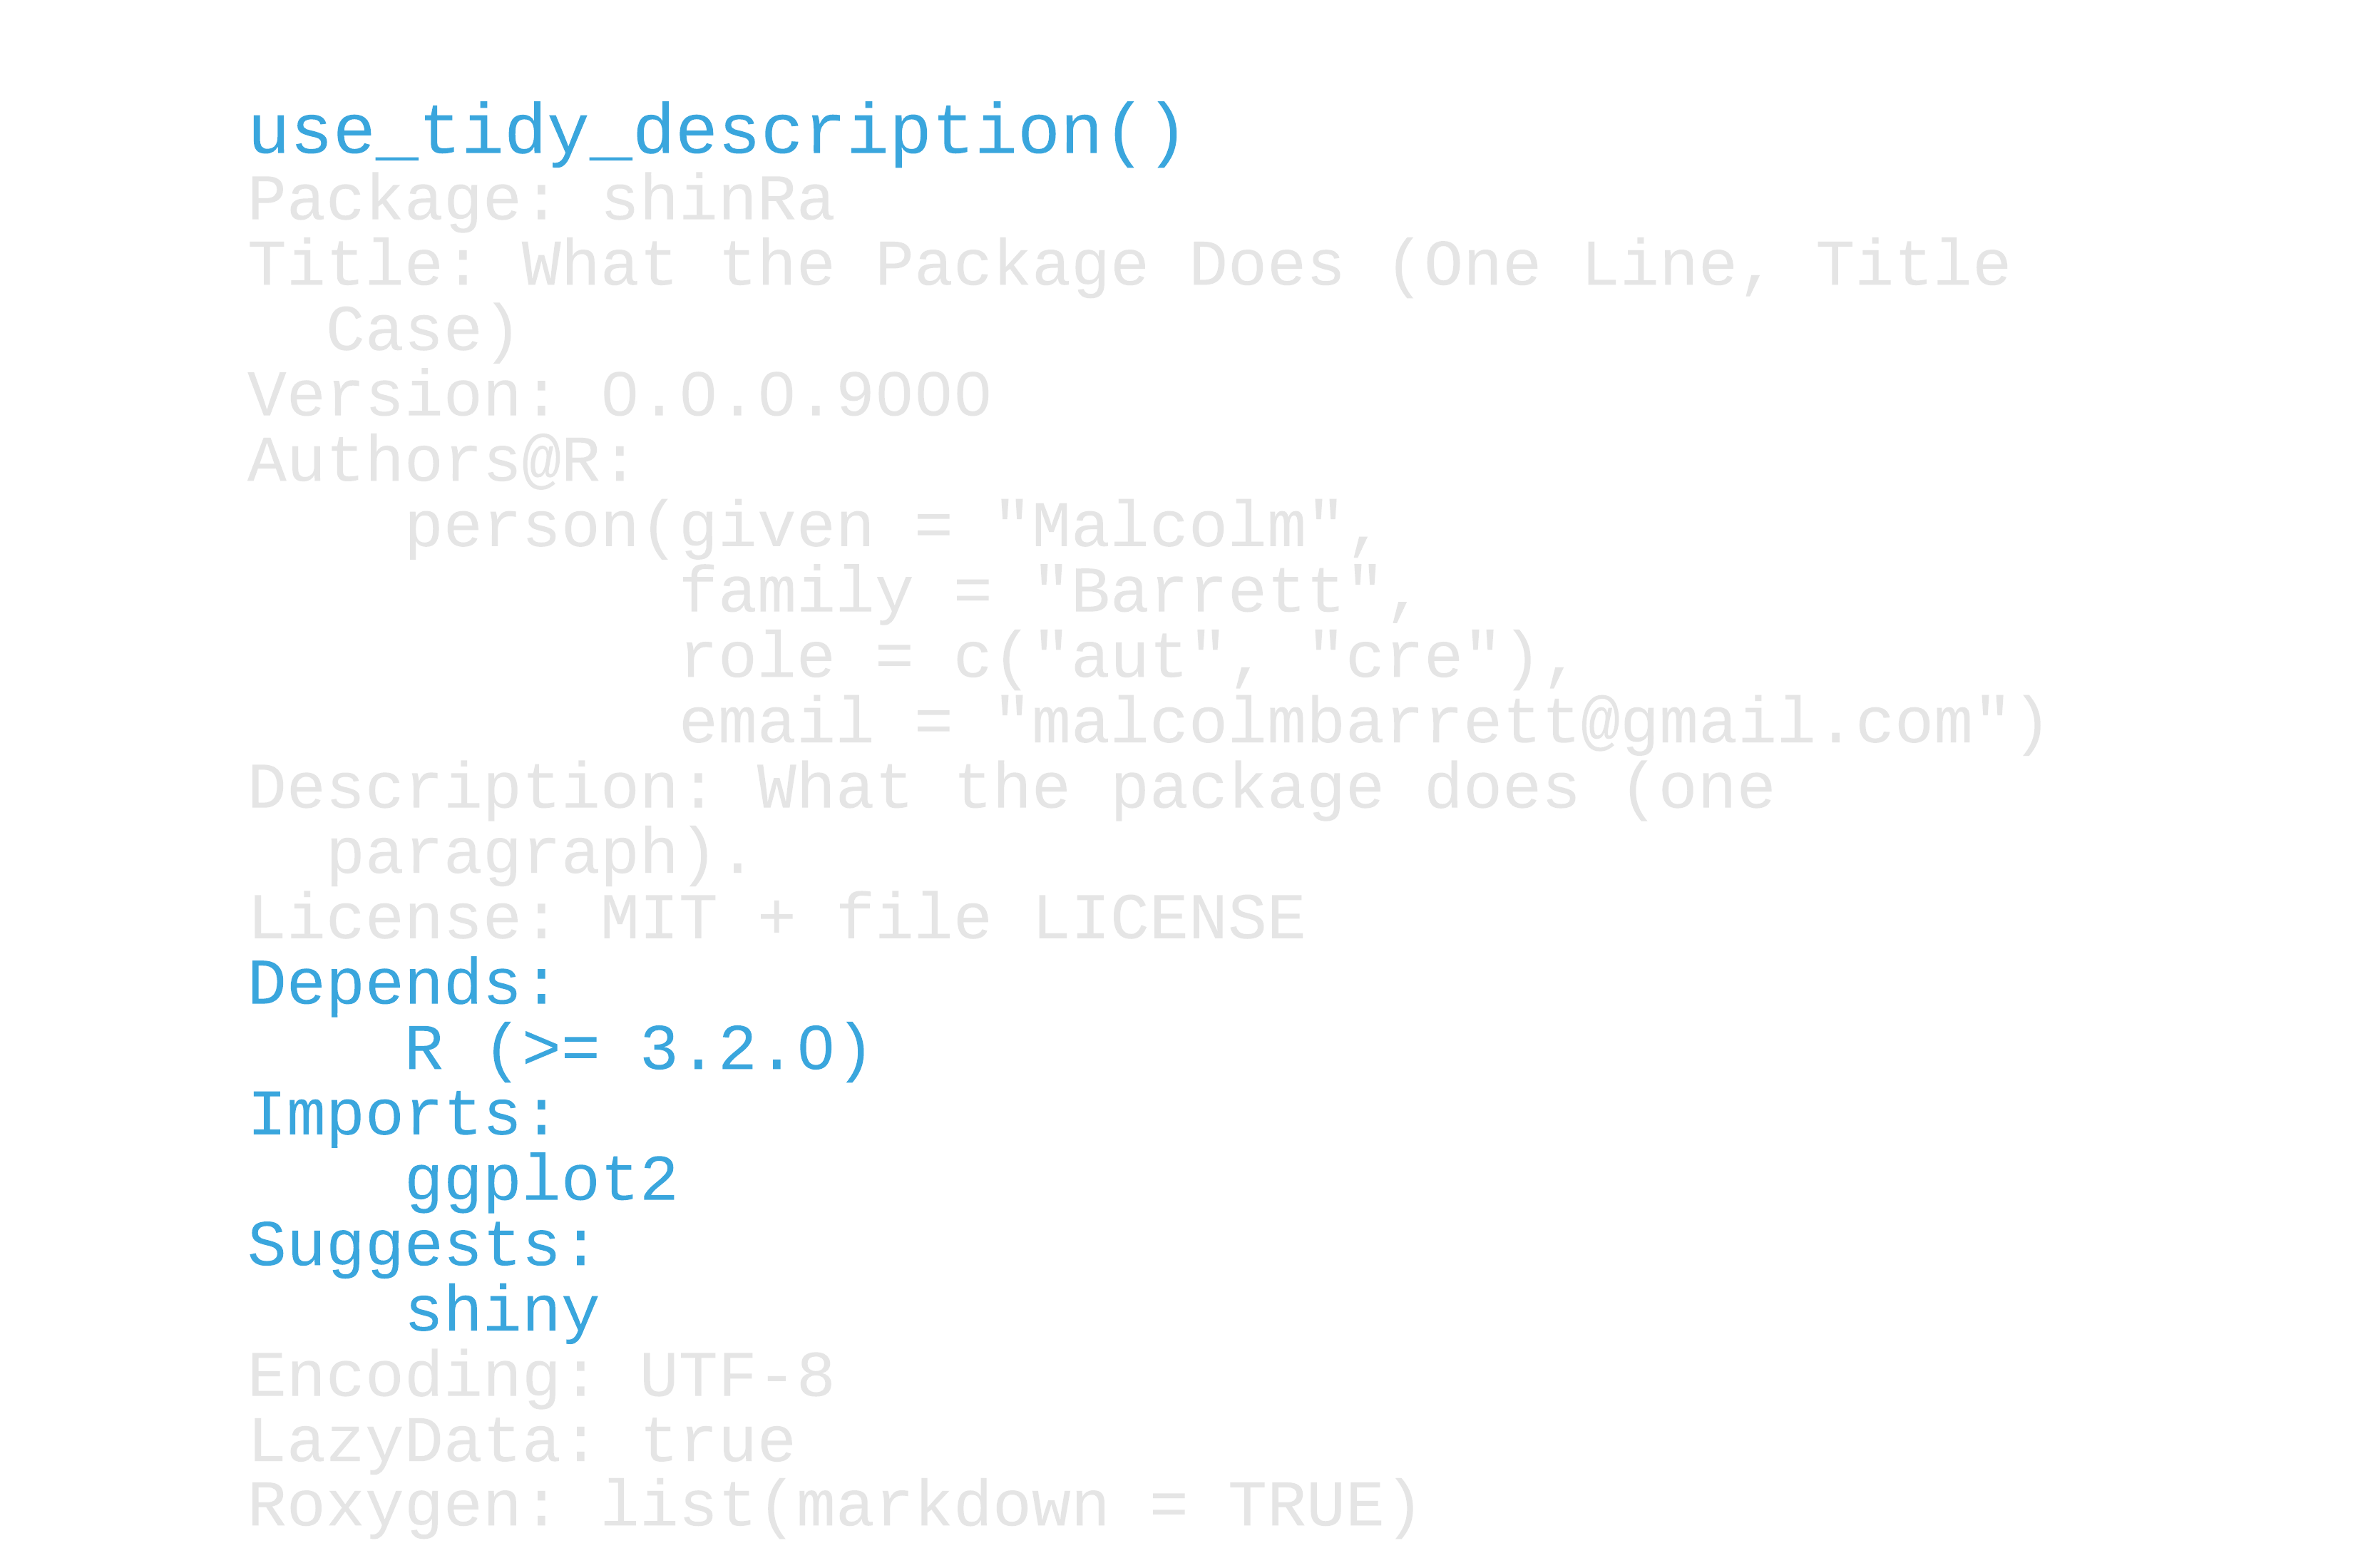
Using other packages
- Import a package with
use_package() - Use the package with
pkg::fun() - DO NOT use
library(). Avoid it completely while developing.
22 / 44
23 / 44
24 / 44
25 / 44
26 / 44
27 / 44
28 / 44
Testing for suggested packages
if (requireNamespace("shiny", quietly = TRUE)) { # ... shiny code}29 / 44
30 / 44
31 / 44
Your Turn 3
Fix the code in R/themes.R to use ggplot2:: instead of library(ggplot2)
Run use_package("ggplot") to add ggplot2 to Imports
Re-load the package (Cmd/Ctrl+Shift+L) and run this code to make sure it works
32 / 44
Your Turn 3
use_package("ggplot2")33 / 44
Your Turn 3
use_package("ggplot2")in R/themes.R:
theme_avalanche <- function() { ggplot2::theme_minimal(base_size = 14) + ggplot2::theme(panel.grid.minor = ggplot2::element_blank())}33 / 44
Your Turn 3

34 / 44
Packages so good they get their own functions
35 / 44
Packages so good they get their own functions
use_tibble()
use_data_table()
use_pipe()
use_rcpp*()
36 / 44
Your Turn 4
We need roxygen2 for this exercise. We'll learn more about it in the next module. For now, just run use_roxygen_md()
Run use_tibble() and use_data_table()
In R/get_data.R, edit the function to be able to return a data table: Add the argument data_table = FALSE. If data_table is TRUE, convert the data frame with data.table::as.data.table()
Run this code to make sure it works
37 / 44
Your Turn 4
use_roxygen_md()use_tibble() use_data_table()get_resident_data <- function(data_table = FALSE) { residents_per_sector <- db_con("residents_per_sector") if (data_table) return(data.table::as.data.table(residents_per_sector)) tibble::as_tibble(residents_per_sector)}38 / 44
Your Turn 4
## sector residents## 1: 1 1000## 2: 2 2034## 3: 3 4594## 4: 4 2304## 5: 5 8093## 6: 6 1200## 7: 7 300## 8: 8 2398data.table::is.data.table(res_data)## [1] TRUE39 / 44
Your Turn 4: Stretch goal
Run use_pipe() to add the magrittr pipe to your package. What changed?
40 / 44
Organizing .R files
41 / 44
Organizing .R files
Less than 1:1, more than all:1
42 / 44
Organizing .R files
Less than 1:1, more than all:1
utils.R
43 / 44
Organizing .R files
Less than 1:1, more than all:1
utils.R
utils.Rzzz.R, .onLoad
See R Packages, ed. 2 for more.
44 / 44