My Organization's First R package
Test R Code
rstudio::conf(2020L)
1 / 50

2 / 50
It’s not that you don’t test your code, it’s that you don’t automate your tests.
—Hadley Wickham
3 / 50
testthat: Unit tests for R
4 / 50
testthat: Unit tests for R
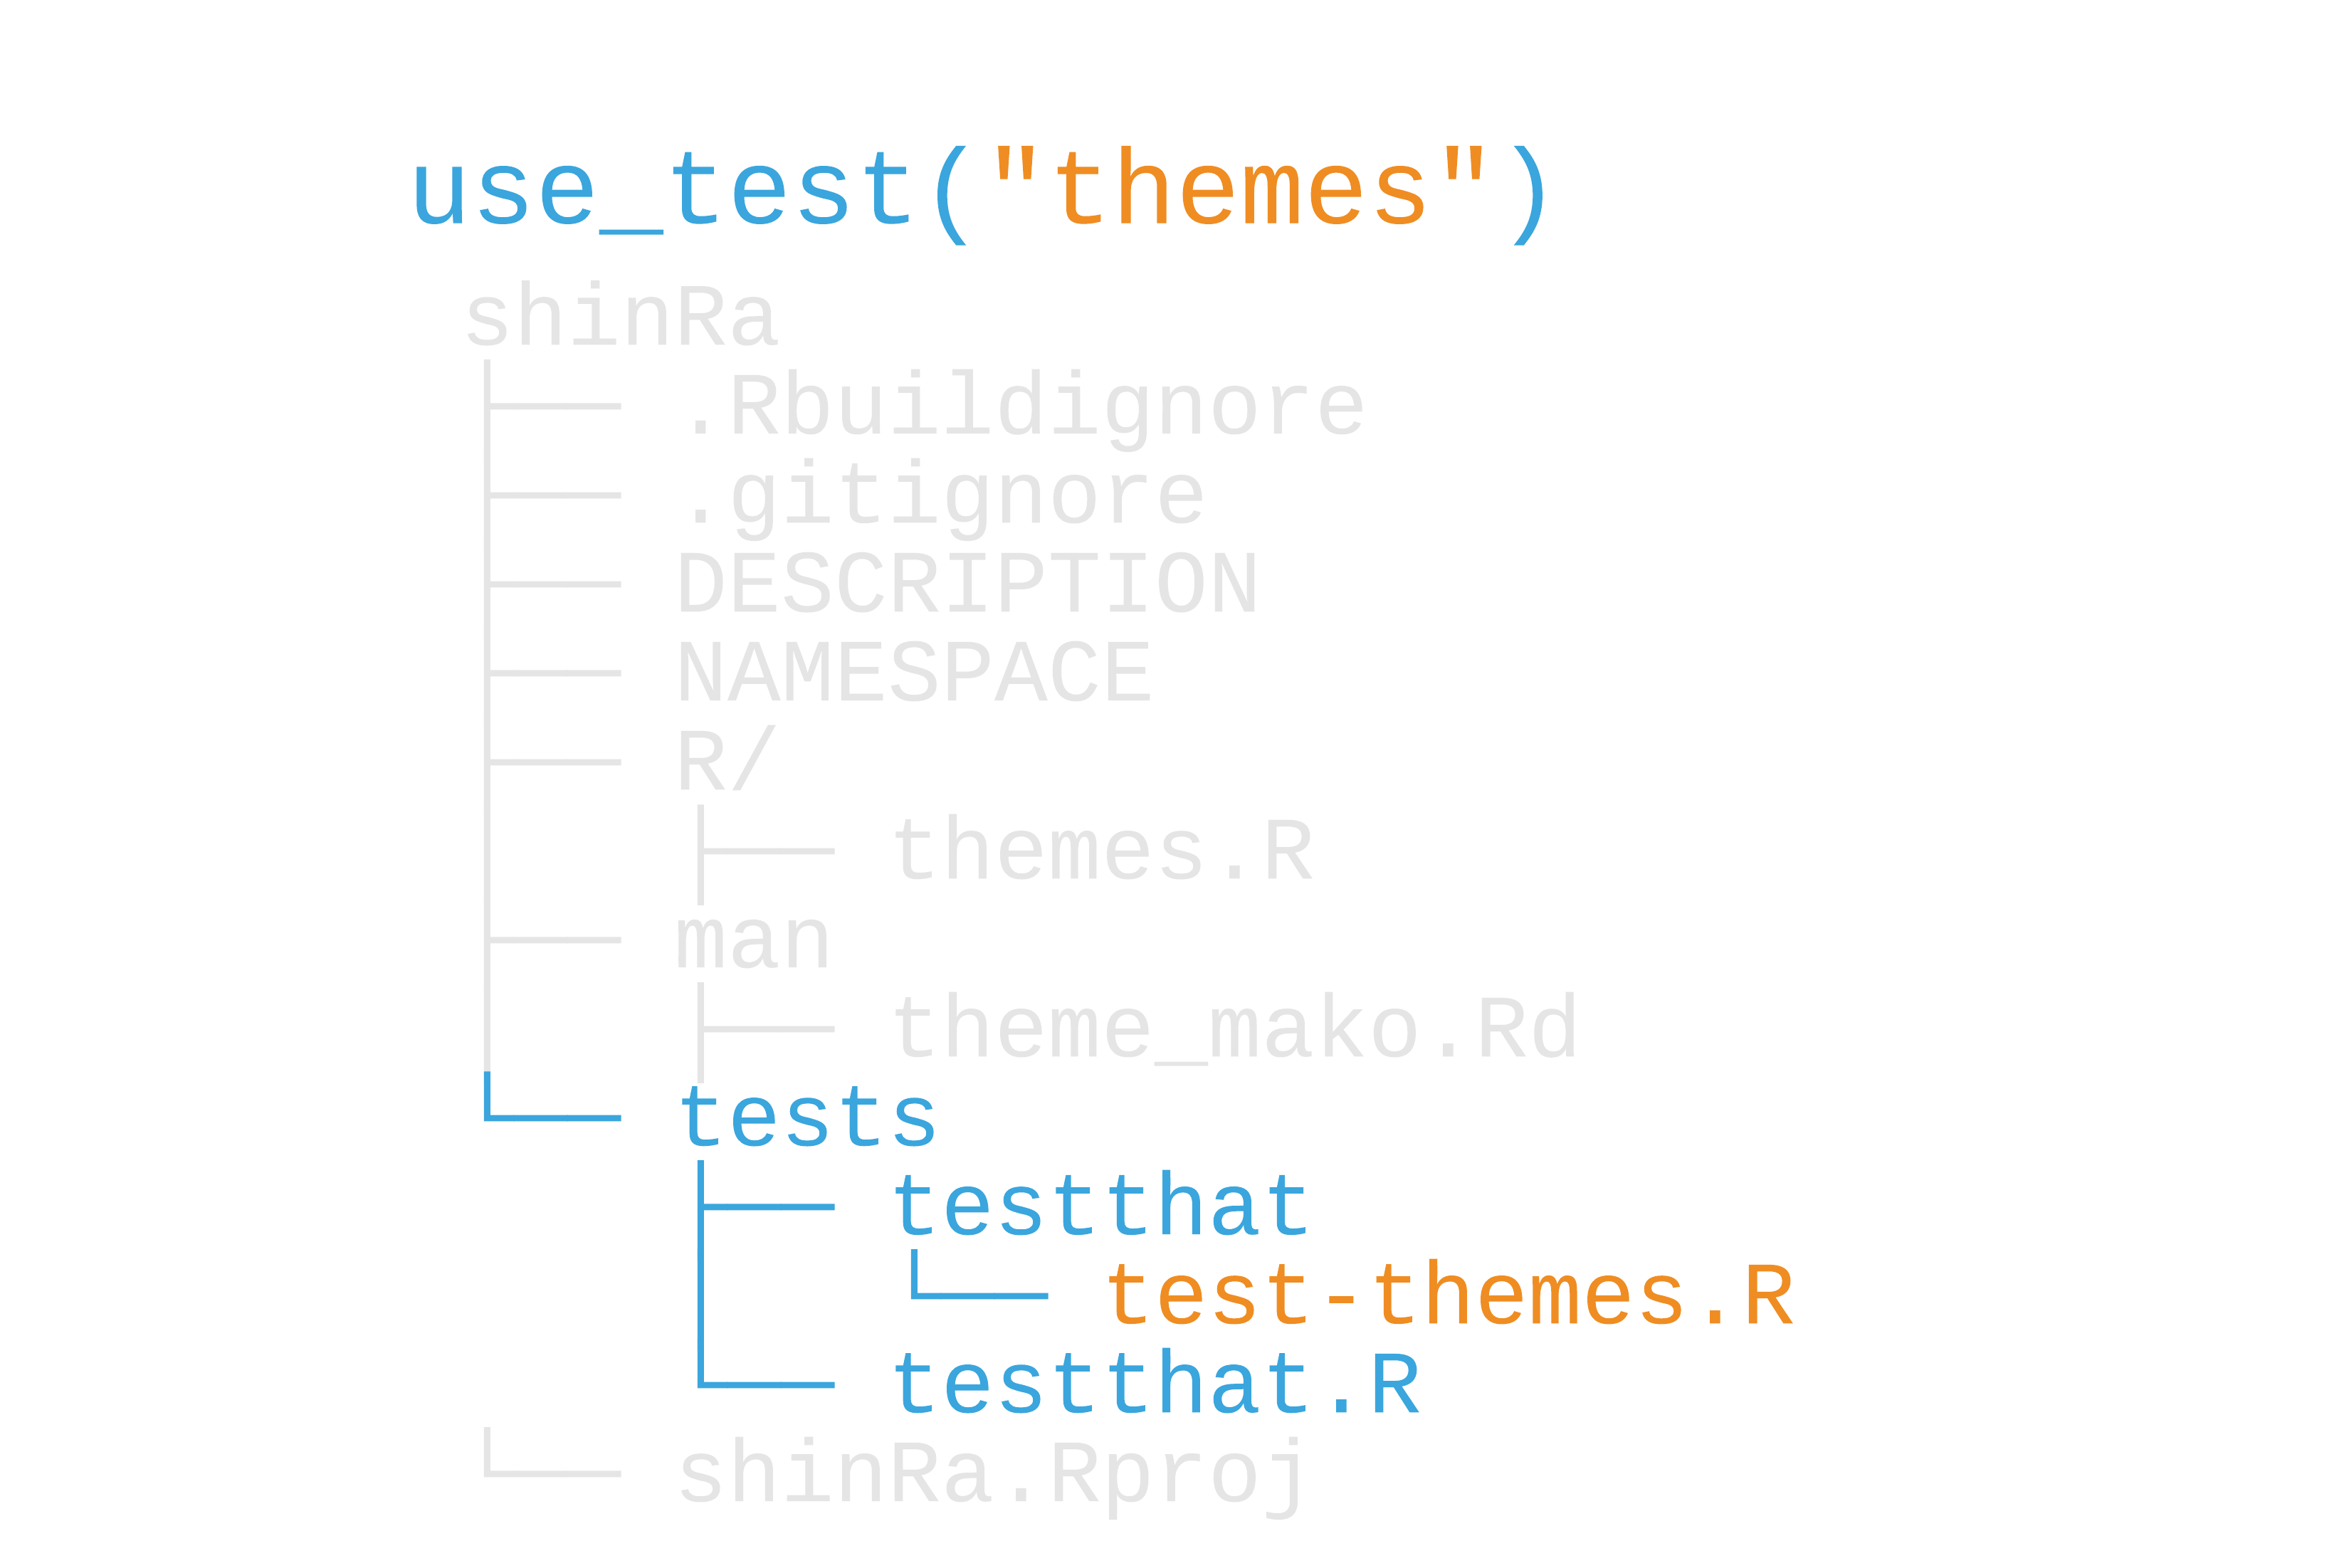
Automate tests (use_test()) using expectations
5 / 50
testthat: Unit tests for R
Automate tests (use_test()) using expectations
use_test()) using expectationsRun tests with test(), test_file(), Cmd/Ctrl + Shift + T.
6 / 50
testthat: Unit tests for R
Automate tests (use_test()) using expectations
use_test()) using expectationsRun tests with test(), test_file(), Cmd/Ctrl + Shift + T.
test(), test_file(), Cmd/Ctrl + Shift + T.Also runs during R CMD Check (check())
7 / 50

8 / 50

9 / 50
Test files
test/testthat/test-themes.R
test_that("theme works", { expect_true(ggplot2::is.theme(theme_mako())) expect_error(theme_mako(base_size = "14"))})10 / 50
Test files
test/testthat/test-themes.R
test_that("theme works", { expect_true(ggplot2::is.theme(theme_mako())) expect_error(theme_mako(base_size = "14"))})11 / 50
Test files
test/testthat/test-themes.R
test_that("theme works", { expect_true(ggplot2::is.theme(theme_mako())) expect_error(theme_mako(base_size = "14"))})12 / 50
Test files
test/testthat/test-themes.R
test_that("theme works", { expect_true(ggplot2::is.theme(theme_mako())) expect_error(theme_mako(base_size = "14"))})test()13 / 50
Test files
test/testthat/test-themes.R
test_that("theme works", { expect_true(ggplot2::is.theme(theme_mako())) expect_error(theme_mako(base_size = "14"))})test()## Loading shinRa## Testing shinRa## ✓ | OK F W S | Context## ✓ | 2 | themes## ## ══ Results ════════════════════════## OK: 2## Failed: 0## Warnings: 0## Skipped: 013 / 50
Test files
test/testthat/test-themes.R
test_that("theme works", { expect_true(ggplot2::is.theme(theme_mako())) expect_error(theme_mako(base_size = "14")) expect_equal(theme_mako(), ggplot2::theme_dark())})14 / 50
test()Loading shinRa✓ | OK F W S | Contextx | 2 1 | themes────────────────────────────────────test-themes.R:4: failure: theme workstheme_mako() not equal to ggplot2::theme_dark().Component “line”: Component “size”: Mean relative difference: 0.2142857Component “rect”: Component “size”: Mean relative difference: 0.2142857Component “text”: Component “size”: Mean relative difference: 0.2142857Component “axis.title.x”: Component “margin”: Mean relative difference: 0.2142857Component “axis.title.x.top”: Component “margin”: Mean relative difference: 0.2142857Component “axis.title.y”: Component “margin”: Mean relative difference: 0.2142857Component “axis.title.y.right”: Component “margin”: Mean relative difference: 0.2142857Component “axis.text.x”: Component “margin”: Mean relative difference: 0.2142857Component “axis.text.x.top”: Component “margin”: Mean relative difference: 0.2115 / 50
Test files
test/testthat/test-themes.R
test_that("theme works", { expect_true(ggplot2::is.theme(theme_mako())) expect_error(theme_mako(base_size = "14")) expect_equal(theme_mako(), ggplot2::theme_dark())})16 / 50
Expectations (expect_*())
| function | expectation |
|---|---|
expect_equal(x, y) |
the same, more or less |
expect_identical(x, y) |
the exact same |
expect_message/warning/error(x, y) |
a message, warning, or error |
expect_true(x) |
TRUE |
expect_is(x, y) |
x is class y |
17 / 50
Expectations (expect_*())
| function | expectation |
|---|---|
expect_equal(x, y) |
the same, more or less |
expect_identical(x, y) |
the exact same |
expect_message/warning/error(x, y) |
a message, warning, or error |
expect_true(x) |
TRUE |
expect_is(x, y) |
x is class y |
MANY more. See https://r-pkgs.org/tests.html
17 / 50
Your Turn 1
Use use_test() to create a new file. Call it "resident_connection"
Change the test description (the first argument of test_that()) to "connection is returning valid data"
In the test_that() function, remove the default expectations. Replace them with this code
Re-load your package.
Press the "Run tests" button in RStudio (above the script pane) or run test_file("tests/testthat/test-resident_connection.R") in the console.
18 / 50
Your Turn 1
use_test("resident_connection")In test-resident_connection.R
test_that("connection is returning valid data", { # `resident_data` is a tibble, isn't empty, and has the right columns resident_data <- get_resident_data() expect_is(resident_data, c("tbl_df", "tbl", "data.frame")) expect_gt(nrow(resident_data), 0) expect_named(resident_data, c("sector", "residents")) # `resident_data_dt` is a data.table resident_data_dt <- get_resident_data(data_table = TRUE) expect_is(resident_data_dt, c("data.table", "data.frame"))})19 / 50
Your Turn 2
Run all the tests in the package using test(). Fix the broken tests.
Hint: The bug is in R/summarize_data.R
Re-run the tests until all of them pass
20 / 50
Your Turn 2
segment_reactor_output <- function(reactor_num, data_table = FALSE) { reactor_output <- hack_shinra_data(data_table = data_table) dplyr::filter(reactor_output, .data$reactor == reactor_num)}21 / 50
use_r() 🤝 use_test()
22 / 50
Organizing tests (VERY soft guidelines)
23 / 50
Organizing tests (VERY soft guidelines)
One test file for each R file
24 / 50
Organizing tests (VERY soft guidelines)
One test file for each R file
One test for every behavior tested
25 / 50
Organizing tests (VERY soft guidelines)
One test file for each R file
One test for every behavior tested
One expectation for every aspect of the test
26 / 50
What should I test? (VERY soft guidelines)
27 / 50
What should I test? (VERY soft guidelines)
External behavior.
28 / 50
What should I test? (VERY soft guidelines)
External behavior.
Don't bother with simple code (unless it's not that simple after all 😬)
29 / 50
Find a bug, write a test
30 / 50
Skipping tests (skip_*())
| function |
|---|
skip() |
skip_if() |
skip_on_cran() |
skip_on_travis() |
skip_on_os() |
31 / 50
Skipping tests (skip_*())
| function |
|---|
skip() |
skip_if() |
skip_on_cran() |
skip_on_travis() |
skip_on_os() |
MANY more. See ?testthat::skip
31 / 50
R CMD Check
32 / 50
R CMD Check
The gold standard
33 / 50
R CMD Check
The gold standard
Builds pkg and docs, checks code quality, runs examples, runs tests, and more!
34 / 50
R CMD Check
The gold standard
Builds pkg and docs, checks code quality, runs examples, runs tests, and more!
check() or Cmd/Ctrl + Shift + E
35 / 50
R CMD Check
The gold standard
Builds pkg and docs, checks code quality, runs examples, runs tests, and more!
check() or Cmd/Ctrl + Shift + E
See all the details at https://r-pkgs.org/r-cmd-check.html
35 / 50
check early, check often
36 / 50
Your Turn 3
Run check() or Cmd/Ctrl + Shift + E
Fix the warnings. Re-run check() until you get a clean bill of health.
Hint: segment_reactor_output() is in R/summarize_data.R
37 / 50
Your Turn 3
use_package("dplyr")#' Segment Shinra reactor data#'#' @param reactor_num The reactor number to segment by.#' @inheritParams hack_shinra_data#'#' @return a tibble or data.table filtered by `reactor_num`#' @export#'#' @examples#'#' segment_reactor_output(7)#'segment_reactor_output <- function(reactor_num, data_table = FALSE) { reactor_output <- hack_shinra_data(data_table = data_table) dplyr::filter(reactor_output, .data$reactor == reactor_num)}38 / 50
R CMD Check Results
| result | meaning | fix required for CRAN? |
|---|---|---|
| Error | A severe problem. Always fix. | Yes |
| Warning | A probable problem. Almost always fix. | Yes |
| Note | A potential issue. Strive to fix. | More or less |
39 / 50
R CMD Check Results
| result | ||
|---|---|---|
| Error | ||
| Warning | ||
| Note |
Shoot for all 0s under almost all circumstances!
40 / 50
Types of test files
| type | file | run |
|---|---|---|
| test | test-*.R |
alphabetical order |
| helper | helper-*.R |
before tests, from load_all() |
| setup | setup-*.R |
before tests, not from load_all() |
teardown teardown-*.R |
after tests |
41 / 50
Types of test files
| type | file | run |
|---|---|---|
| test | test-*.R |
alphabetical order |
| helper | helper-*.R |
before tests, from load_all() |
| setup | setup-*.R |
before tests, not from load_all() |
teardown teardown-*.R |
after tests |
All located in tests/testthat/
41 / 50
Your Turn 4
Both test-count-donations.R and test-tables.R use donations_test_data. Let's move it to a helper file. First, create the file with fs::file_create("tests/testthat/helper-donations_data.R"). Open it manually or use edit_file().
Move the code to create donations_test_data into helper-donations_data.R.
Remove the donations_test_data code from the two test files.
Run the tests.
42 / 50
Your Turn 4
fs::file_create("tests/testthat/helper-donations_data.R")In tests/testthat/helper-donations_data.R
donations_test_data <- data.frame( donor_id = 1:15, sector = c(7L, 2L, 8L, 6L, 5L, 5L, 8L, 1L, 5L, 4L, 4L, 3L, 7L, 5L, 8L), donation = c( 529.58, 16.64, 410.88, 448.73, 211.62, 642.53, 410.93, 707.38, 30.19, 573.02, 286.31, 734.73, 971.81, 30, 465.92 ))43 / 50
Continuous Integration (CI)
Run R CMD Check with every commit
Travis, Appveyor, others
46 / 50
Continuous Integration (CI)
Run R CMD Check with every commit
Travis, Appveyor, others
use_travis(), use_appveyor(), etc
47 / 50
GitHub Actions
All of the above and more!
Newer service
48 / 50
GitHub Actions
All of the above and more!
Newer service
use_github_actions_*()
49 / 50